
Figure 6.
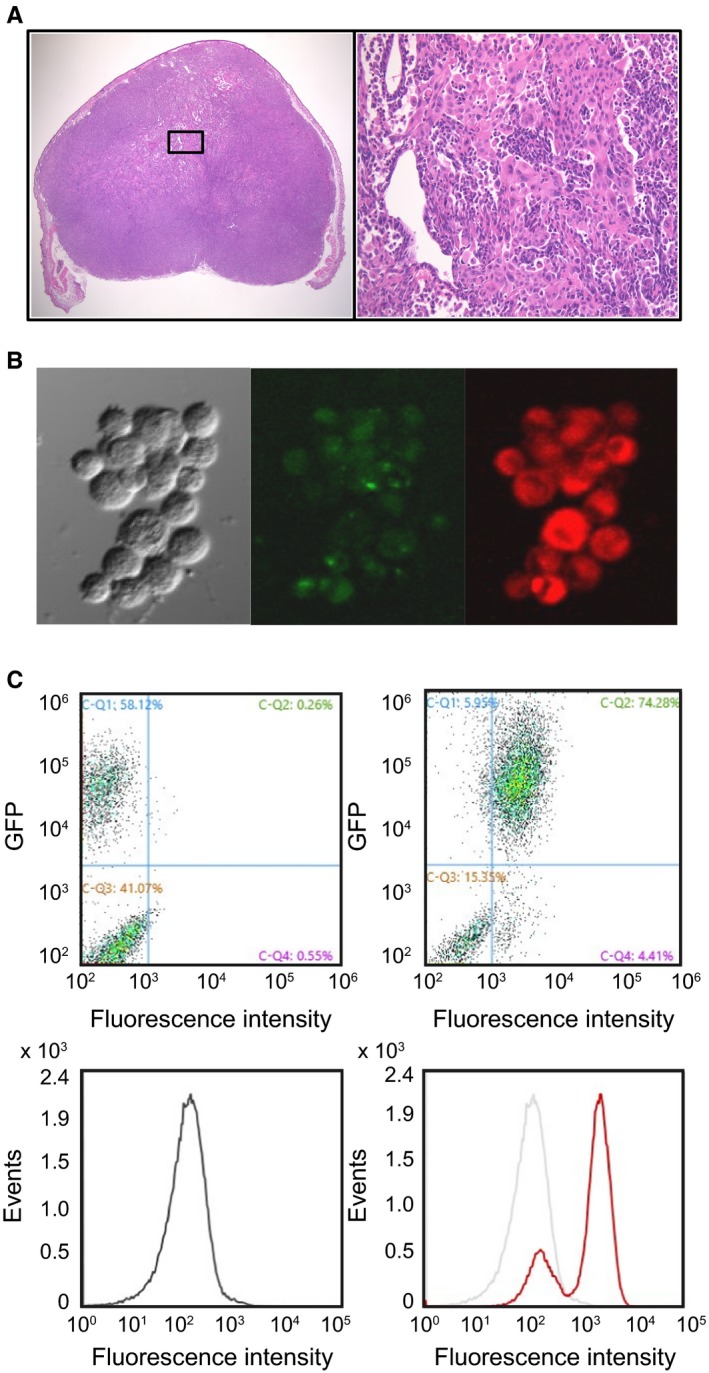
Fluorescent analysis on Fine needle aspiration (FNA) specimens obtained from Enhanced green fluorescent protein (EGFP)‐expressing human breast cancer xenografts. (A), Hematoxylin‐eosin (HE) stained images of a subcutaneous xenograft. (B), Images of EGFP‐expressing MDA‐MB‐231 cells obtained through FNA after exposure to 5‐ALA and Ko143. Differential interference contrast (left), GFP fluorescence (middle) (λ ex: 488 nm, λ em: 520‐550 nm), and PpIX‐fluorescence (right) (λ ex: 440 nm, λ em: 615‐645 nm) images acquired from the same area. (C), Flow cytometric analyses from the cells with (right) and without (left) exposure to 5‐ALA and Ko143. The histogram indicated by black line denotes the control group (upper left panel). The red line shows the treatment group with 5‐ALA and Ko143 (upper right panel)