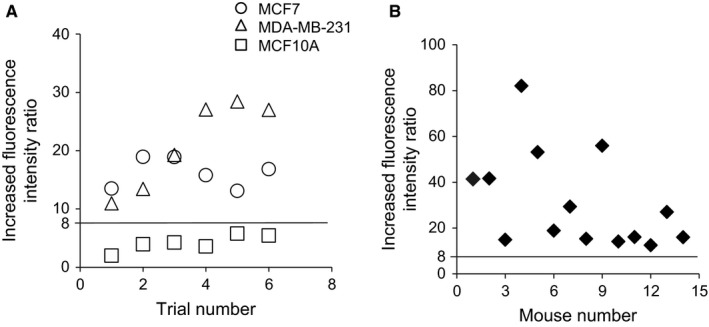
Figure 7.

FI ratio between breast cancer cells and noncancer cells after treatment with 5‐ALA and Ko143. (A), The cutoff line at 8, yields 100% sensitivity and 100% specificity for differentiating cancer from noncancer cells. Each value indicates the ratio of the mean FI of cells after the drug exposure over the mean FI without the drug, that is, the autofluorescence intensity. Circles, triangles, and rectangles denote the data of MCF7, MDA‐MB‐231, and MCF10A cells, respectively (n = 6). (B), Plots of the FI ratio of FNAC‐FI from the xenograft (n = 14). All FI ratios of cancer cells were higher than the cutoff value
