Figure 2.

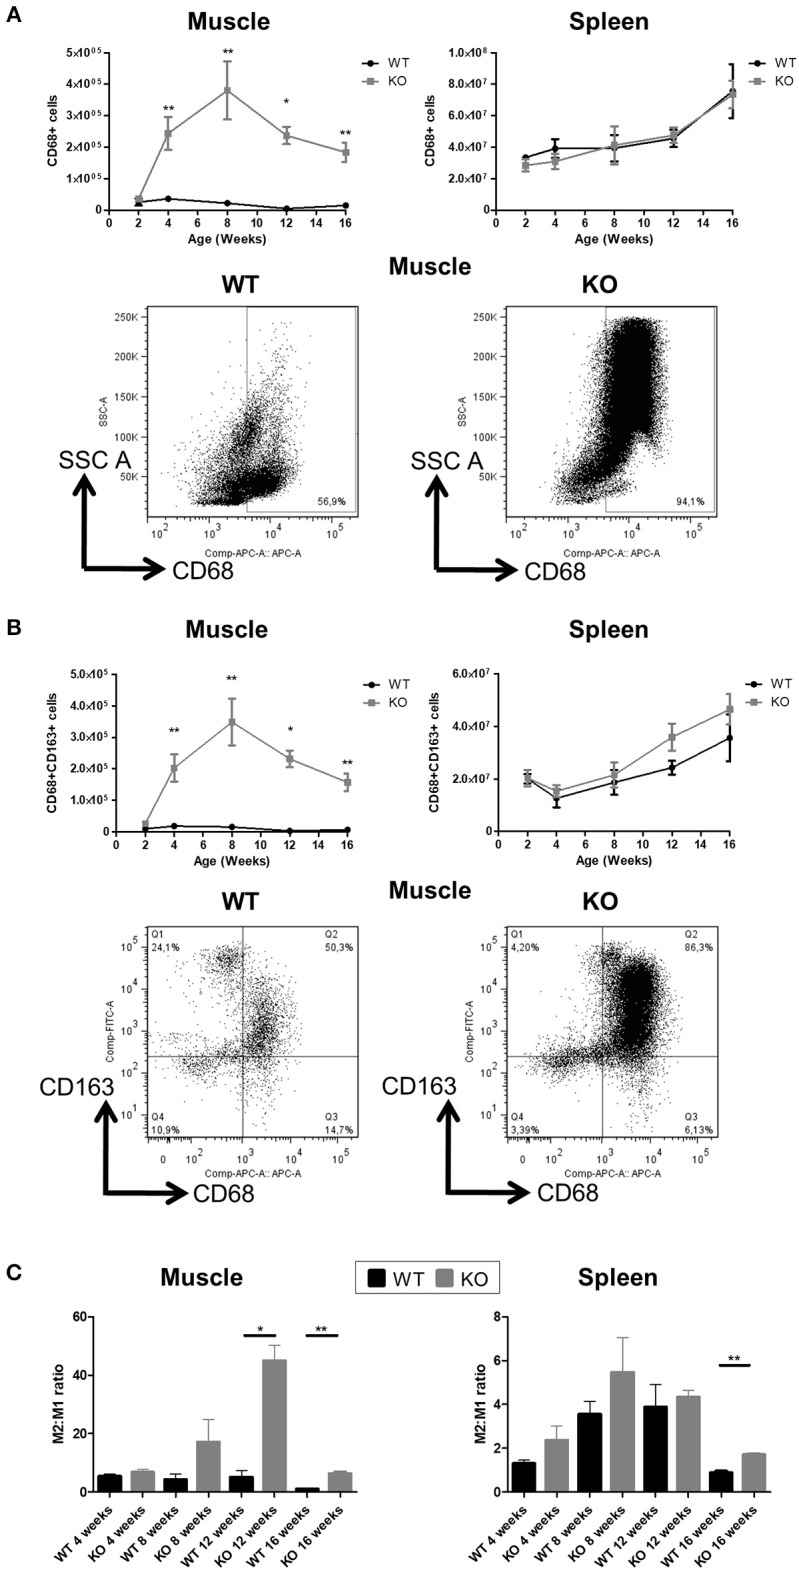
Number of macrophages in the skeletal muscle and spleen of Dmdmdx rats. Cytofluorimetry of single-cell suspensions from hind limb muscles or spleen of WT or Dmdmdx (KO) rats at the indicated time points. (A) Total number of macrophages (CD68+ cells) per gram of muscle (upper left panel) or whole spleen (upper right panel). Representative dot plots of high granularity macrophages using side scatter (SSChigh) vs. CD68+ cells after gating on viable (negatively stained cells) CD45+ cells from muscle of WT or Dmdmdx 12-week old rats (lower panel). (B) Total number of viable CD68+CD163+ type 2 macrophages per gram of muscle (upper left panel) or whole spleen (upper right panel). Representative dot plots of viable CD68+CD163+ cells from muscle of WT or Dmdmdx 12-week old rats (lower panels). (C) Type 2 (CD68+CD163+) to type 1 macrophage (CD68+CD163−) ratios in muscle (left panel) or spleen (right panel) of WT (black) or Dmdmdx (gray) rats. Data presented in (A–C) are given as mean ± SEM of 3, 6, 6, 7, and 8 (at 2, 4, 8, 12, and 16 weeks of age, respectively) Dmdmdx rats and of 4, 6, 4, 3, and 4 (at 2, 4, 8, 12, and 16 weeks of age, respectively) WT rats. *p < 0.05 and **p < 0.01. Results were obtained from several experiments (n = 1, 2, 2, 3, and 3 at 2, 4, 8, 12, and 16 weeks of age, respectively) which were performed using all animal groups in each experiment.
