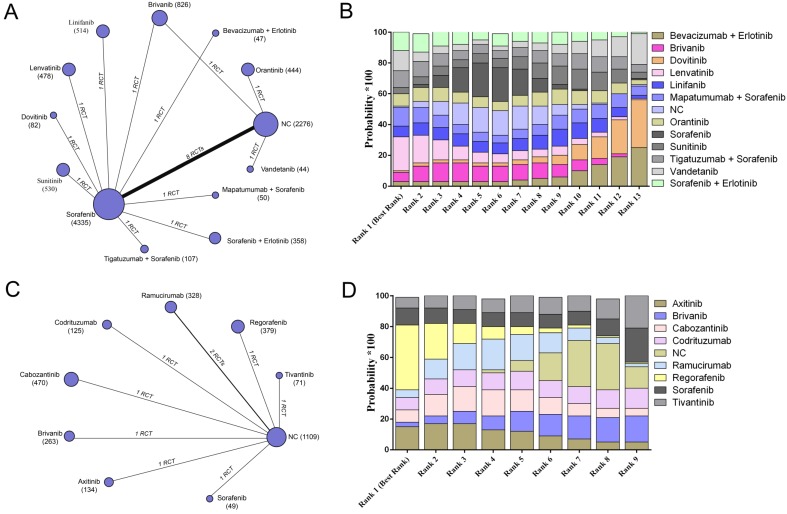
Figure 2.
The network evaluation of included agents regarding overall survival. (A) Network connections of all of the included trials for patients without previous systematic treatments; (B) SUCRA values and ranks of included agents for patients without previous systematic treatments; (C) Network connections of all of the included trials for patients with previous systematic treatments; (D) SUCRA values and ranks of included agents for patients with previous systematic treatments. The numbers on the line indicate the quality of studies compared with every pair of strategies, which are also represented by the width of the lines. Additionally, the sizes of the areas of the circles indicate the respective sample sizes. NC, negative control.

