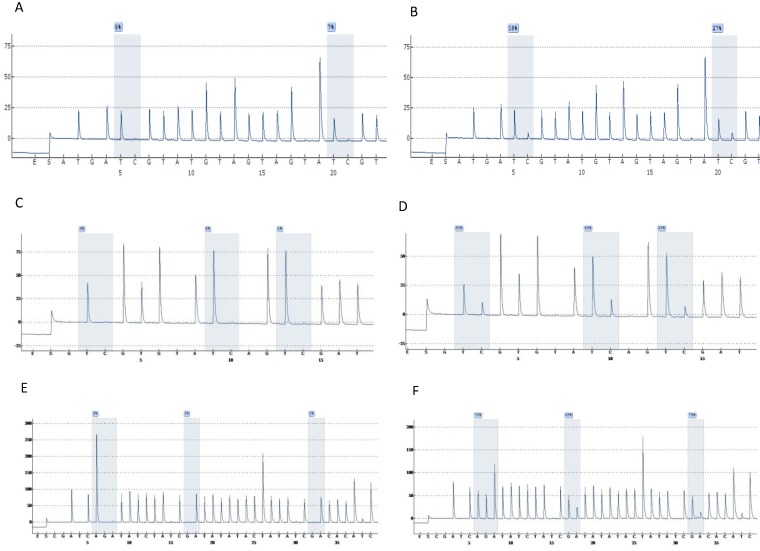
Figure 1.
Pyrograms depicting unmethylated (left column) and methylated samples (right column). Grey blocs are presenting the under investigation CG sites and numbers at blue squares the methylation percentages. A & B, UTR genomic region sites 7535, 7553. C & D, E6 genomic region sites 494, 502, 506. E & F, E7 genomic region sites 765, 780, 790 (a reverse primer was used for pyrosequencing of this region).

