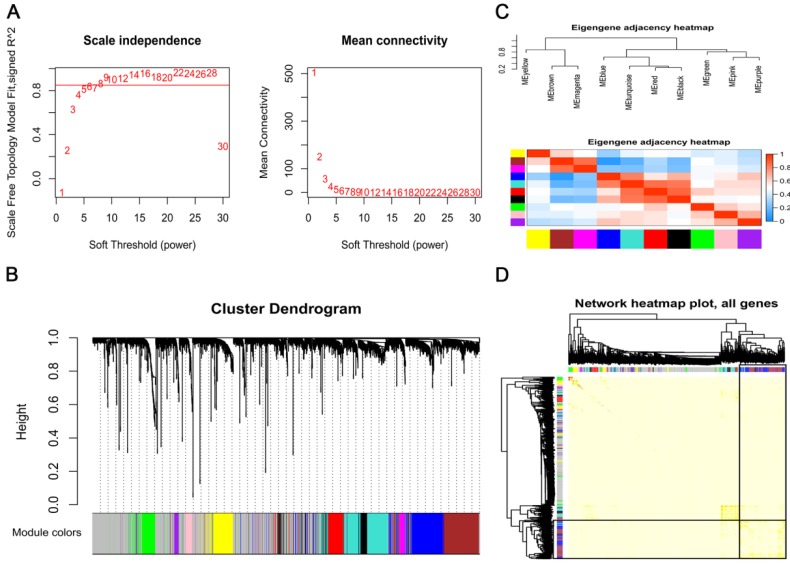
Figure 2.
Construction of a weighted gene co-expression network. (A) Analysis of the scale-free topology model fit index for soft threshold powers (β) and the mean connectivity for soft threshold powers. (B) A cluster dendrogram was built based on the dissimilarity of the topological overlap, which presents 11 gene co-expression modules in AML. The grey module indicates none co-expression between the genes. (C) Correlated heatmap plot of the adjacency modules in the WGCNA. The rectangle of each row and column represents a module eigengene. In the correlated heatmap plot, light blue represents low adjacency, while red represents high adjacency. (D) Topological overlap matrix (TOM) plot in the gene co-expression network of the intramodules. In the TOM plot, the light color indicates topological overlap, while the darker color indicates high topological overlap. The gene dendrogram and corresponding modules are shown along the left and top of the TOM plot. The intersection of the two rectangles indicates the topological overlap in the blue module.

