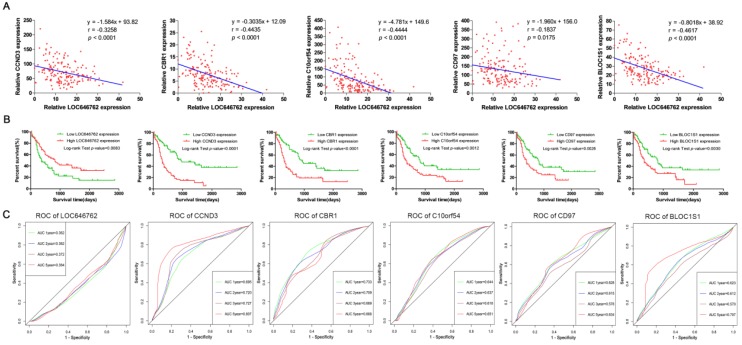
Figure 6.
Prognostic lncRNA and mRNAs in adult AML. (A) The correlation between the expression of LOC646762 and the prognostic mRNAs in AML. r: Pearson correlation coefficient. (B) Kaplan-Meier curves for overall survival (OS) in low and high expression of the prognostic lncRNA and mRNAs. (C) Time-dependent ROC curves for the prognostic lncRNA and mRNAs. Green, blue, brown and red indicate the sensitivity curve, and grey represents the identify line.

