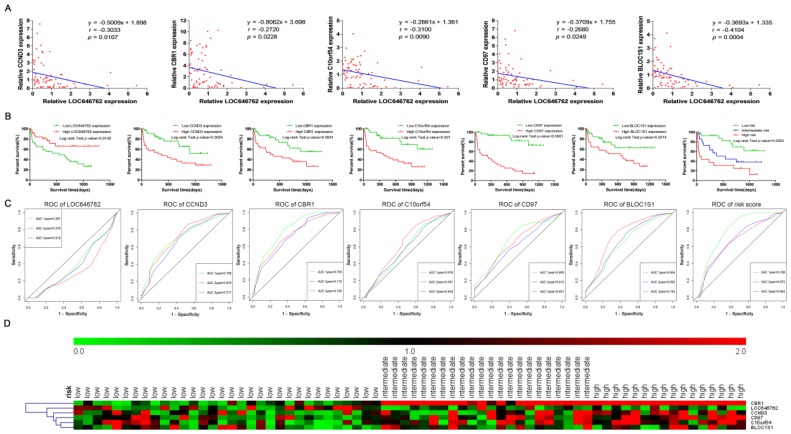
Figure 8.
Validation of LOC646762, CCND3, CBR1, C10orf54, CD97 and BLOC1S1 based on the clinical samples of adult AML. (A) The correlation between the expression of LOC646762 and the mRNAs in AML. (B) Kaplan-Meier curves for the lncRNA, mRNAs and risk stratification. (C) Time-dependent ROC curves for the lncRNA, mRNAs and risk score. Green, blue, brown and red indicate the sensitivity curve, and grey represents the identify line. (D) Heatmap for the lncRNA and mRNA expression levels among the low, intermediate, and high risk groups in 70 AML patients.

