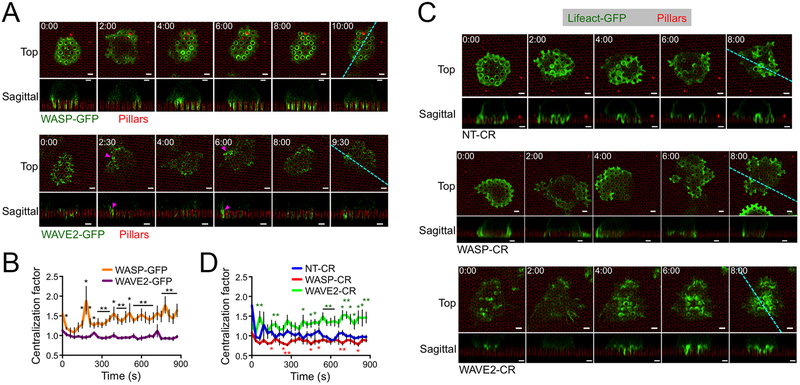
Figure 5. WASP and WAVE2 control distinct subsets of protrusions.
(A-B) OT1 CTLs expressing WASP-GFP or WAVE2-GFP were imaged by confocal microscopy on fluorescent micropillars bearing H2-Kb-OVA and ICAM1. (A) Time-lapse montages of representative CTLs, with micropillars shown in red. z-projection images (top views) are shown above with sagittal views below. Cyan dotted lines denote the slicing planes used for the sagittal images. Magenta arrowheads indicate representative lateral accumulations of WAVE2-GFP. (B) Centralization factor analysis of WASP-GFP and WAVE2-GFP, with time 0 denoting initial contact with the pillars. N = 6 for each cell type. (C-D) NT-CR, WASP-CR, and WAVE2-CR CTLs expressing Lifeact-GFP were imaged by confocal microscopy on fluorescent micropillars bearing H2-Kb-OVA and ICAM1. (C) Time-lapse montages of representative CTLs, with micropillars shown in red. z-projection images (top views) are shown above with sagittal views below. Cyan dotted lines denote the slicing planes used for the sagittal images. (D) Centralization factor analysis of Lifeact-GFP in NT-CR, WASP-CR, and WAVE2-CR OT1 CTLs, with time 0 denoting initial contact with the pillars. N = 6 for each cell type. In all montages, time in MM:SS is indicated in the upper left corner of each top view image. Scale bars = 2 μm. In graphs, * and ** indicate P < 0.05 and P < 0.01, respectively, calculated by two-tailed Student’s T-test comparing WASP-GFP to WAVE2-GFP (B) or WASP-CR (red) and WAVE2-CR (green) to NT-CR (C). Error bars denote SEM.

