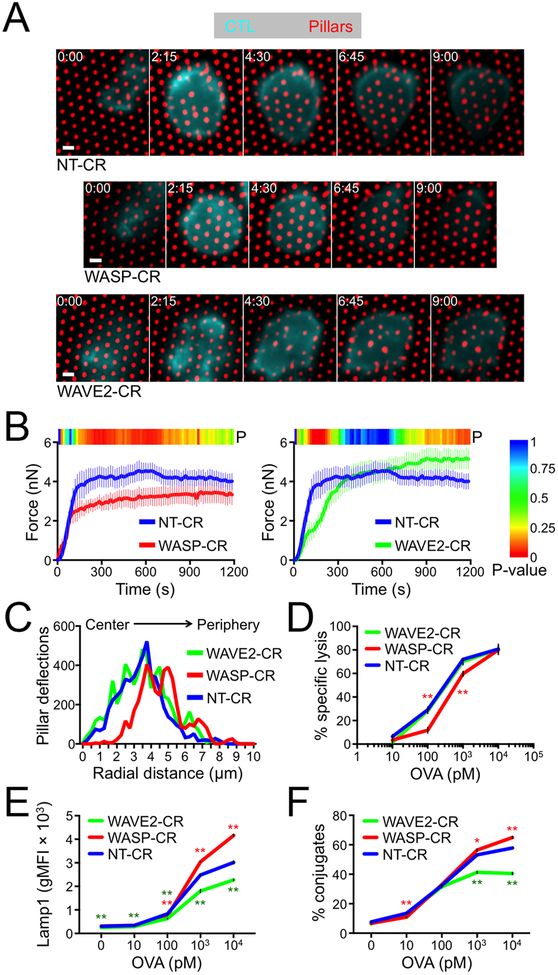
Figure 6. WASP and WAVE2 depletion induce distinct functional phenotypes.
(A-B) NT-CR, WASP-CR, and WAVE2-CR OT1 CTLs were labeled with a fluorescent anti-CD45 Fab and imaged on narrow fluorescent micropillars coated with H2-Kb-OVA and ICAM1. (A) Time-lapse montages of representative CTLs showing pillar deflection. Time in M:SS is indicated in the upper left corner of each top view image. Scale bars = 2 μm. (B) Total force exertion against pillar arrays was graphed versus time. Color bar above each graph indicates the P-value for each time point (two-tailed Student’s T-test). (C) Histogram showing the distribution of strong deflections as a function of radial distance from the center of the IS. N = 10 for each cell type in B and C. (D-F) RMA-s target cells were loaded with increasing concentrations of OVA and mixed with NT-CR, WASP-CR, or WAVE2-CR OT1 CTLs. (D) Specific lysis of RMA-s cells. (E) Lytic granule fusion measured by surface exposure of Lamp1. (F) CTL-target cell conjugate formation measured by flow cytometry. All error bars denote SEM. In D-F, * and ** indicate P < 0.05 and P < 0.01, respectively, calculated by two-tailed Student’s T-test comparing WASP-CR (red) and WAVE2-CR (green) to NT-CR.

