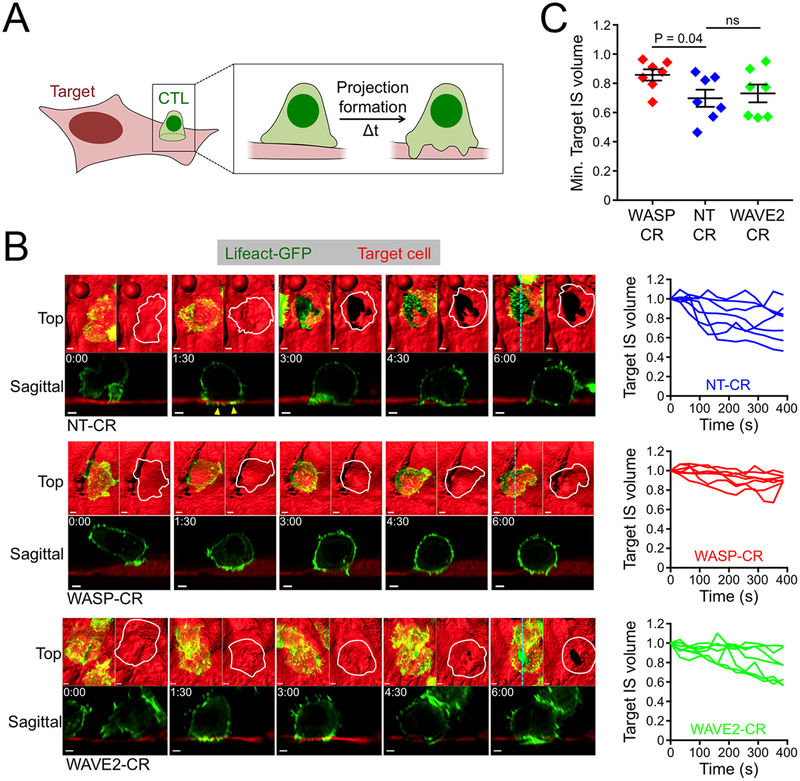
Figure 7. WASP controls target cell deformation at the IS.
(A) Schematic diagram of a CTL deforming an adherent target cell. (B-C) NT-CR, WASP-CR, and WAVE2-CR OT1 CTLs expressing Lifeact-GFP were applied to cultures of OVA-loaded endothelial target cells expressing iRFP670 and imaged using lattice light-sheet microscopy. (B) Left, time-lapse montages of representative “vertically” oriented synapses, with z-projection images (top views) shown above and sagittal views below. Cyan dotted lines denote the slicing planes used for the sagittal images. In z-projection images, target cells are visualized by surface representation. Two z-projections are shown for each time point; Lifeact-GFP is shown on the left and the outline of the CTL of interest on the right. Time in M:SS is indicated in the upper left corner of each sagittal image. Scale bars = 2 μm. Yellow arrowheads denote protrusive structures in the NT-CR CTL that invade the target cell space. Right, target IS volume graphed against time, with time 0 denoting IS initiation. Each line corresponds to one CTL-target cell conjugate. (C) Graph of minimum target IS volume values achieved during the first 400 s of conjugate formation. N = 7 for each cell type. Error bars denote SEM. P calculated by two-tailed Student’s T-test.

