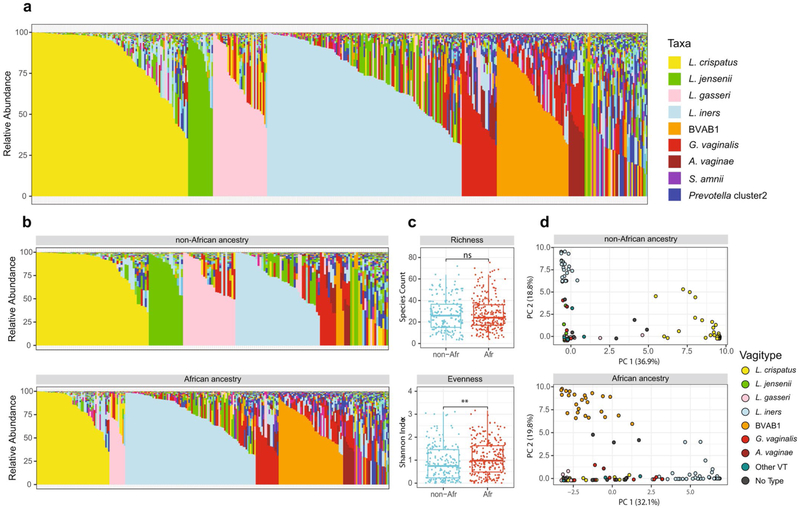
Extended Data Fig. 3 ∣. Vaginal microbiome profiles of 90 women, 49 of African and 41 of non-African ancestry.
a, Microbiome profiles of all samples (421 total, 175 from women of non-African ancestry and 246 from women of African ancestry) from each of these 90 women. Taxa are color-coded as indicated. b, Microbiome profiles of these same samples from women of non-African (top) and African ancestry (bottom). Taxa are color-coded as in a. c, Alpha diversity measures of richness (species counts) and evenness (Shannon index) of these samples (described in a) from women of non-African (n-Afr) and African (Afr) ancestry, measured using the vegan package. Alpha diversities and statistical analysis were calculated as indicated in the Methods. Box plots were generated in R using standard approaches. The bar represents the median and the boxes indicate interquartile ranges. d, L1-Norm PCA analysis of the same samples (see Methods). Legend of vagitypes is as indicated. See Supplementary Table 5 for sequence read statistics for data presented in this figure.

