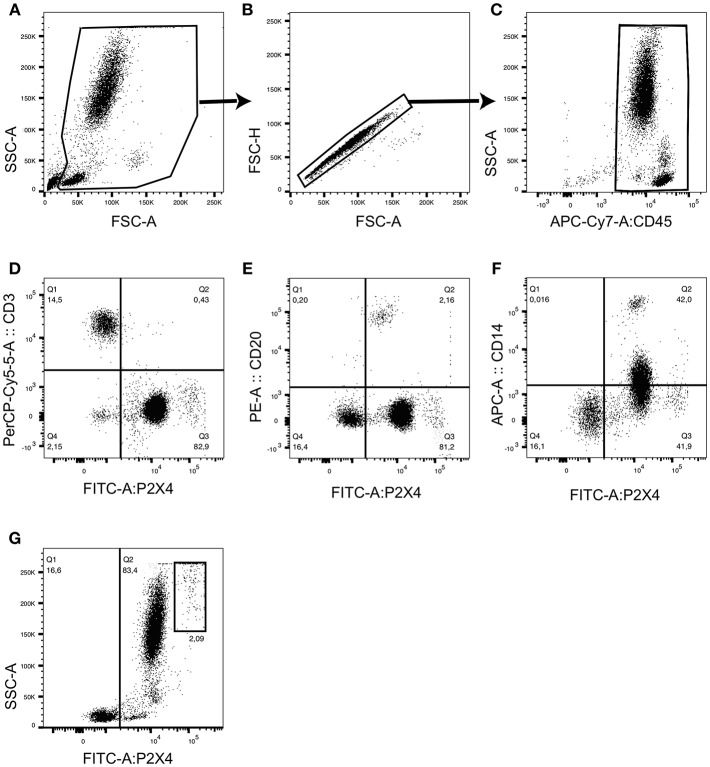
Figure 6.
Flow cytometry analyses of hP2X4 expression by CD45+ PBL. The gating strategy is presented in (A–C). CD45+ leukocytes were stained with fluorochrome-coupled anti-P2X4 mAb27 and with anti-CD3, anti-CD20 and anti-CD14 mAbs. Representative dot plots show P2X4 vs. CD3 (D), P2X4 vs. CD20 (E) and P2X4 vs. CD14 (F) expressions within the CD45+ leukocyte population. A representative dot plot shows the expression of P2X4 vs. side scatter (SSC) and identifies a highly granular P2X4 high subpopulation (G). This subpopulation represented about 2% of the CD45+ leukocyte population. Quadrants were placed based on the fluorescent levels observed in isotype controls. Additional controls are shown on Figure S3.

