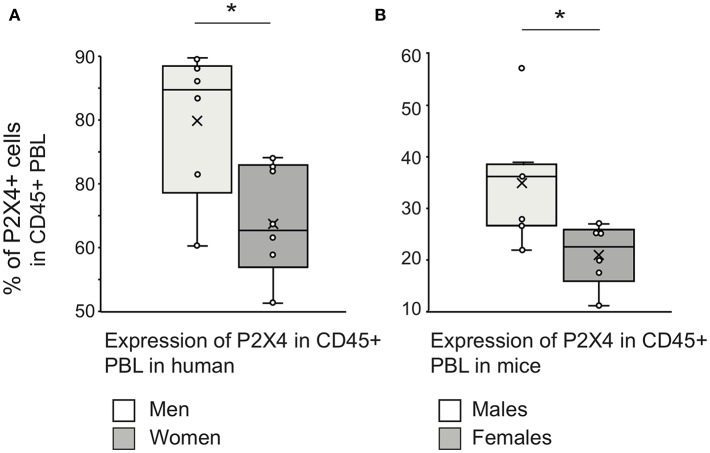
Figure 9.
Gender difference in P2X4 expression by peripheral blood leukocytes. Whiskers plots of percentages of CD45+P2X4-positive within PBL of healthy men (n = 6) and women (n = 6) (A), or within PBL of healthy males (n = 6) and females (n = 6) C57BL6 mice (B). The percentage of P2X4-positive cells was measured using flow cytometry, the cut-off threshold being determined from staining using isotype control. The “X” sign denotes the mean value, the horizontal bar the median, and the whiskers show maximum and minimum values. The “*” sign denotes a statistically significant difference (p < 0.05) between the compared groups. Welch's t-test was applied to test the significance between groups (human: p = 0.021; mouse: p = 0.022), since a Shapiro–Wilkinson test supported that data had normal distribution. Additionally, a Mann–Whitney test supported a significant difference between male and female mice groups (p = 0.014).

