
Figure 1.
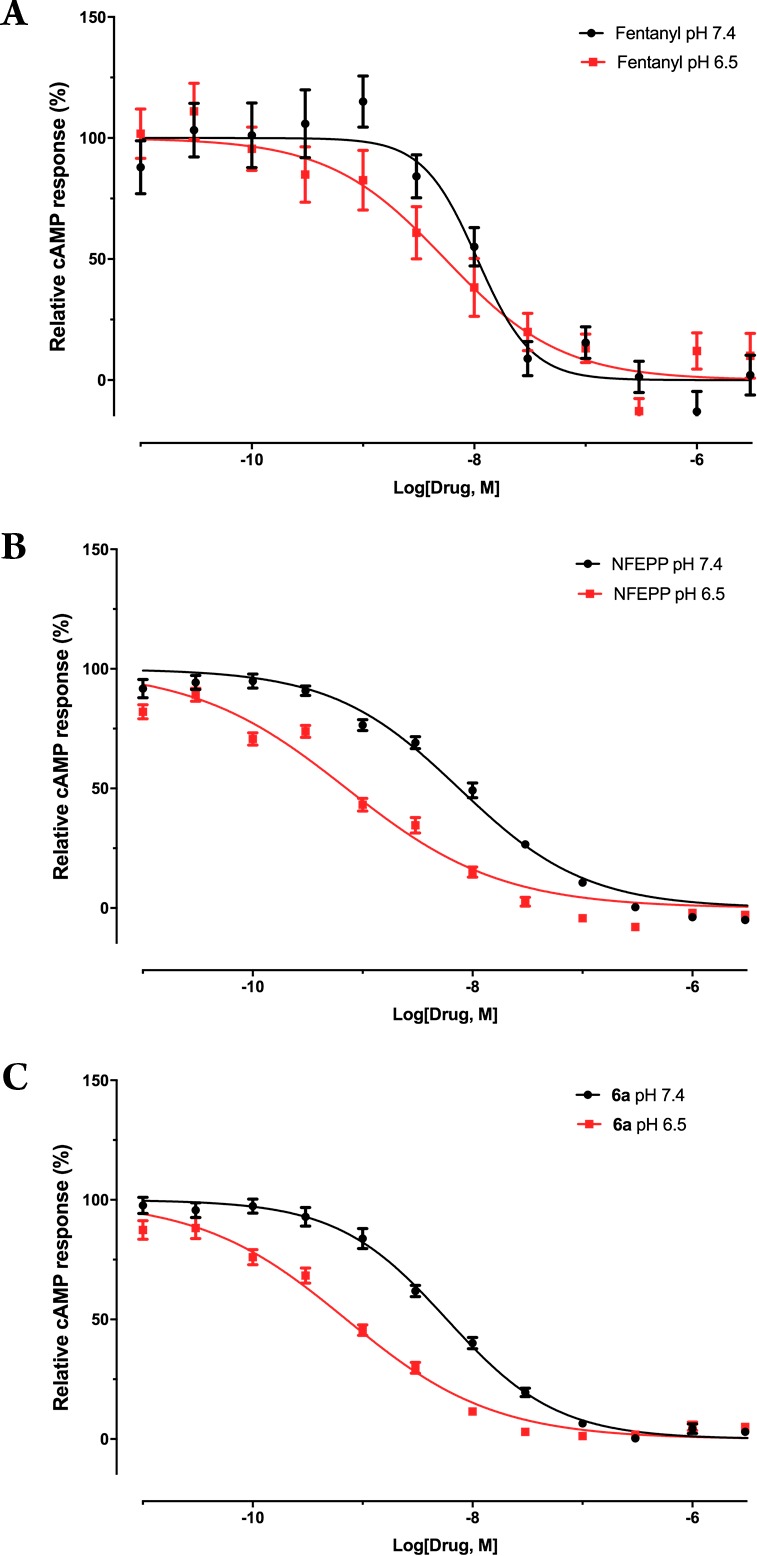
Concentration–response curves of (A) fentanyl; (B) NFEPP; and (C) 6a in GloSensor MOR cAMP assay. Data was individually normalized to each compound to show % response.
Official websites use .gov
A
.gov website belongs to an official
government organization in the United States.
Secure .gov websites use HTTPS
A lock (
) or https:// means you've safely
connected to the .gov website. Share sensitive
information only on official, secure websites.
Concentration–response curves of (A) fentanyl; (B) NFEPP; and (C) 6a in GloSensor MOR cAMP assay. Data was individually normalized to each compound to show % response.