
Figure 2.
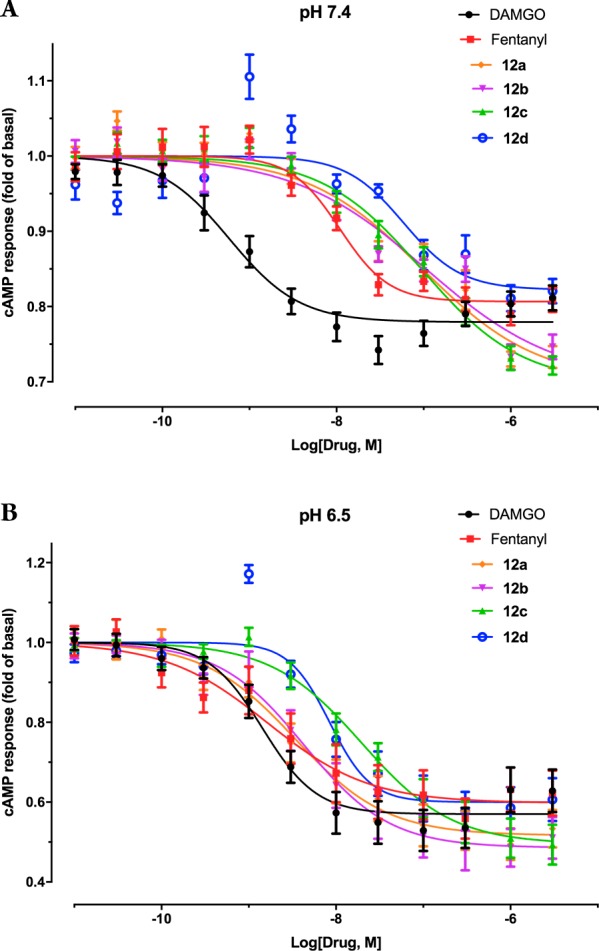
Concentration–response curves (fold activity) of DAMGO, fentanyl, and agonists 12a–d in the GloSensor MOR cAMP assay at pH 7.4 (A) and 6.5 (B). Results were normalized with basal activity as 1.0 and analyzed in Prism using the built-in 4-parameter logistic function.