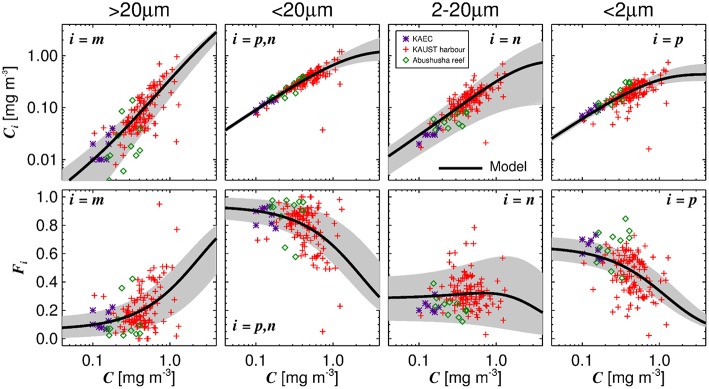
Figure 2.
Fits of the three-component model to size-fractionated filtration (SFF) data collected in the study. Top row shows the absolute chlorophyll concentrations (Cm, Cp,n, Cn, and Cp) and bottom row the fractions (Fm, Fp,n, Fn, and Fp) plotted as a function of total chlorophyll (C), with the tuned three-component model (parameters from Table 2) overlain. Gray shading represents a model ensemble varying parameters between their confidence intervals (Table 2).

