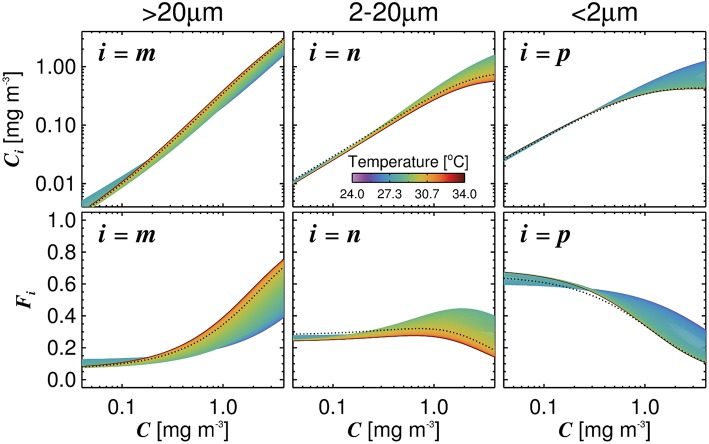
Figure 4.
Influence of temperature on the relationship between size-fractionated chlorophyll and total chlorophyll, when incorporating Equations (5)–(8) into the three-component model. Top row shows the size-fractions of chlorophyll and bottom row the fractions of total chlorophyll in each size class, all plotted as a function of total chlorophyll. Dashed black lines refer to the model using a single set of parameters (Table 2).

