
Fig. 2. In vitro and in vivo functionality of the S-MiNDS.
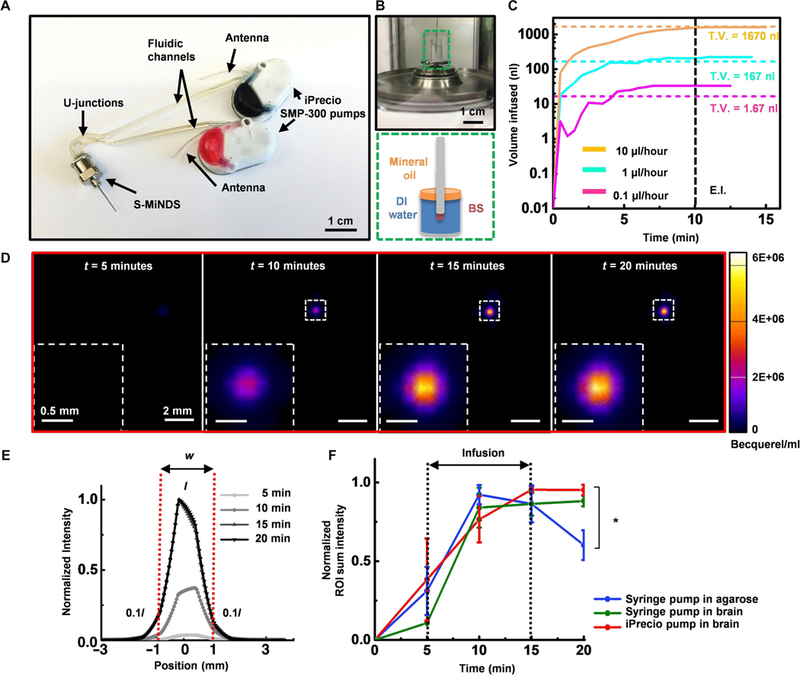
(A) Image of a MiNDS with U-junctions connected to two independently controlled iPrecio SMP-300 pumps. (B) Illustration of in vitro pump characterization setup with distinct layers of water and oil in the weighing dish as represented in green dashed box. (C) Line graph showing the mean infusion profiles of three infusion trials through S-MiNDS with flow rates 0.1, 1, and 10 μl/hour. End infusion (E.I.) (black dashed line) represents the end of infusion, and total volume (T.V.) (colored dashed lines) denotes the theoretical value of the volume infused. (D) Positron emission tomography (PET) images of Cu-64 in vivo delivery via an implanted MiNDS as seen in (A) (3 μCi/μl iPrecio infusion, 1.67-μl infusion at 10 μl/hour). Representative images at 5, 10, 15, and 20 min after Cu-64 injection show Cu-64 expression (fluorescence scale is depicted on the right). (E) Normalized fluorescence intensity in relation to position across the bolus. The diameter (w) of the bolus was determined using a three-dimensional (3D) region of interest (ROI), where the borders were defined as 10% of peak core intensity (I). (F) Normalized ROI sum fluorescence intensity at different times for identical Cu-64 infusions delivered into an agarose phantom (0.6% by weight) and in the rat brain through implanted S-MiNDSs using a syringe pump and an iPrecio pump (n = 3 trials; error bars represent SE). Statistical analysis was done using one-way ANOVA followed by Tukey post hoc test at each time point. Significance differences were only found at time = 20 min. *P < 0.05. DI, deionized.