
Fig. 4. In vivo MiNDS evaluation in an NHP.
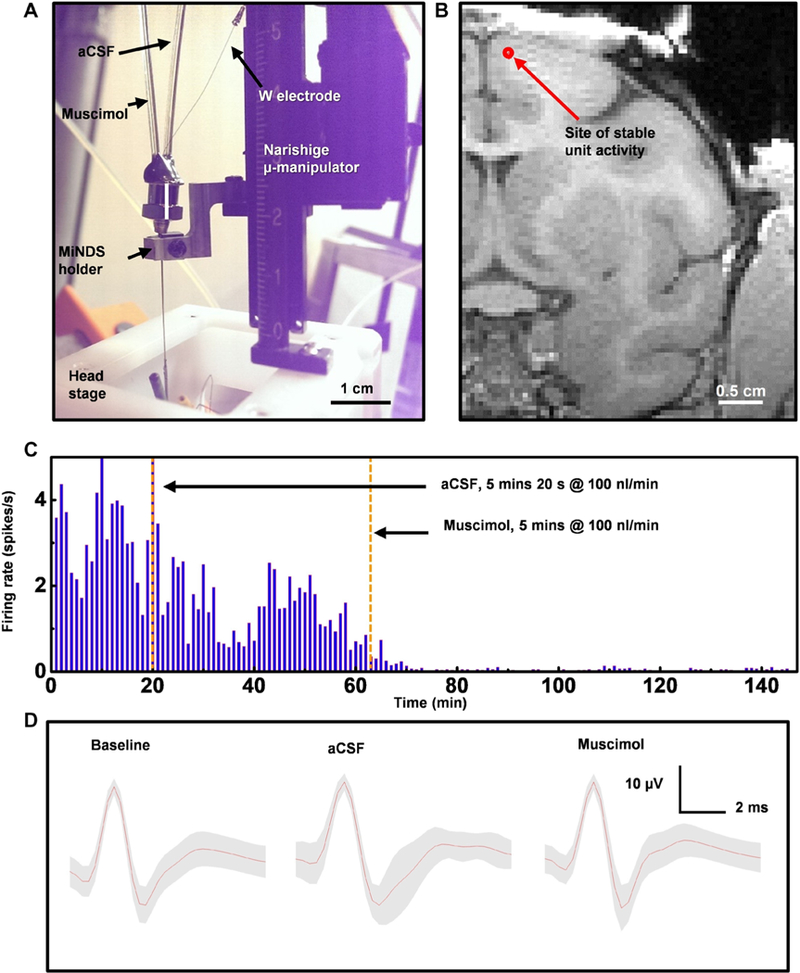
(A) Image of an experimental setup integrated with the head stage of a nonhuman primate (NHP). (B) Magnetic resonance imaging (MRI) image showing the estimated location of the L-MiNDS infusion and recording. Estimated coordinates of the L-MiNDS tip are 22 mm (anteroposterior) and 2 mm (mediolateral) from the bregma. (C) Unit rate histograms for 1-min bins. The first vertical orange dashed line indicates the start of artificial cerebrospinal fluid (aCSF) infusion (at 20 min), and the second vertical orange dashed line denotes the time of muscimol infusion (at 63.7 min) (n = 1 unit). (D) Average waveforms for units binned during each period (preinfusion baseline, 4593 waveforms; aCSF infusion, 51 waveforms; and muscimol infusion, 165 waveforms) with SD in gray shading