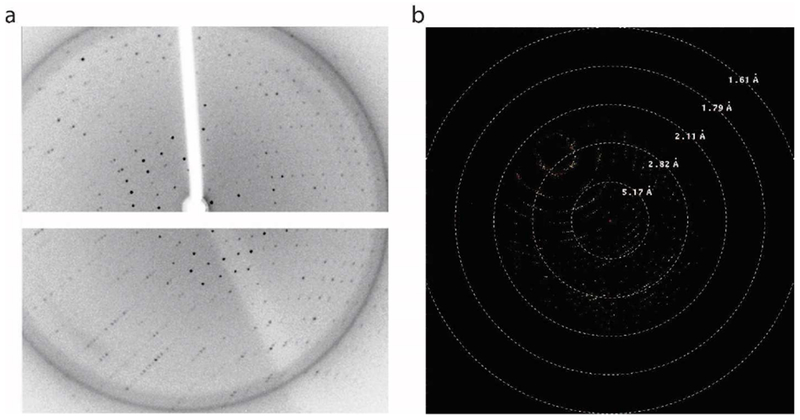
Figure 3. ALDH16B1 crystal diffraction.

a) Diffraction data obtained from the home source at Yale School of Medicine Macromolecular X-ray Facility. A complete data set was collected at 2.8 Å (wavelength=1.5418 Å). b) A complete data set was also collected from the National Synchrotron Light Source II (NSLS-II) at 2.5 Å (wavelength=1.7438 Å).
