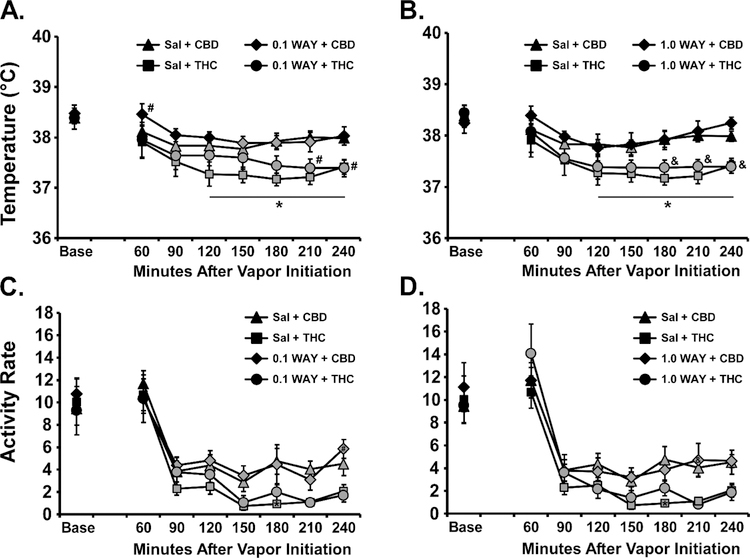
Figure 4:
Mean (N=8; SEM) A, B) body temperature and C, D) activity following inhalation of cannabidiol CBD (100 mg/mL) or THC (100 mg/mL), by male Wistar rats, with pre-inhalation injection with WAY 100,635 (0.1, 1.0 mg/mg, i.p.). Shaded symbols indicate a significant difference from the Baseline (Base), within treatment condition A significant difference between CBD and THC with saline pretreatment is indicated by *, with 0.1 mg/kg WAY pretreatment by # and with 1.0 mg/kg WAY pretreatment by &.

