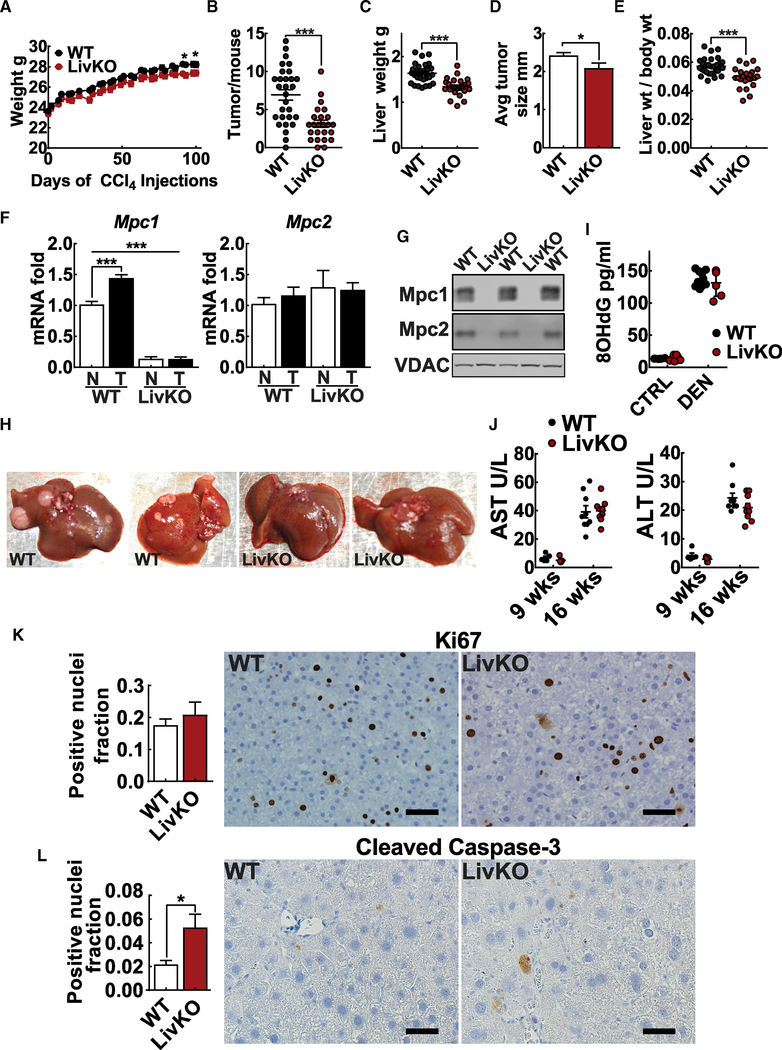
Figure 2. Hepatic Mpc1 Deletion Decreases Hepatocellular Carcinoma Development.
(A) Body weight of WT and MPC LivKO mice over course of CCl4 treatment; n = 24–29 biological replicates.
(B) Liver tumor burden at euthanasia, determined by grossly dissecting each liver lobe and examining for and counting visible tumors; please see STAR Methods section for additional detail; n = 24–29 biological replicates
C) Liver mass at euthanasia, determined by removing and weighing whole livers; n = 24–29 biological replicates.
(D) Average tumor size, measured by calipers; n = 152 WT and 54 MPC LivKO tumors measured.
(E) Calculated liver-to-body weight ratio for WT and MPC LivKO mice; n = 24–29 biological replicates.
(F) Mpc1 and Mpc2 gene expression by qPCR in paired normal-adjacent non-tumor tissue (NT) and tumor tissue (T) in WT and MPC LivKO samples; n = 4 biological replicates per condition per genotype analyzed by one-way ANOVA.
(G) Representative western blot of Mpc1 and Mpc2 expression in normal-adjacent non-tumor liver tissue of WT and MPC LivKO mice. VDAC loading control.
(H) Representative liver images.
(I) 8-OHdG ELISA on day 15 saline-injected (CTRL) or DEN-injected (DEN) pups; n = 4–11 biological replicates.
(J) AST and ALT measured in plasma taken from WT and MPC LivKO mice after 9 weeks of CCl4 injections (n = 5, biological replicates) and prior to euthanasia; n = 10 biological replicates.
(K) Ki67 staining of WT and MPC LivKO tumors; scale bar, 50 μm; n = 5–6 biological replicates.
(L) Cleaved caspase-3 staining of WT and MPC LivKO tumors; scale bar, 50 μm; n = 5–6 biological replicates.
Data are presented as mean ± SEM, compared by t test unless otherwise noted (*p < 0.05, **p < 0.01, ***p < 0.001). See also Figures S1, S2, and S3.

