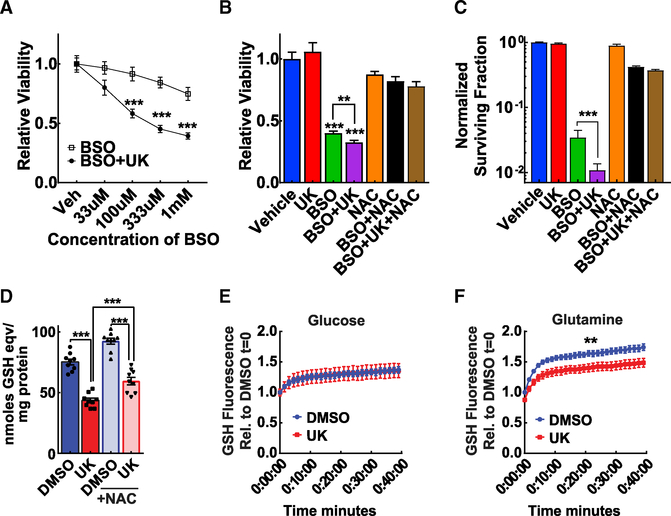
Figure 4. MPC Disruption Decreases Viability and Glutathione Content in Hepa1–6 Cells and Primary Hepatocytes.
(A) Hepa1–6 cells treated for 48 h with 5 μM UK5099 (UK) or 5 μM UK5099 (UK) + varied concentrations of BSO. Viability measured by resazurin assay; n = 16–18 replicate wells.
(B) Hepa1–6 cells treated for 48 h with DMSO (Vehicle), 5 μM UK5099 (UK), 1 mM buthionine sulfoximine (BSO), 1 mM BSO + 5 μM UK5099, 5 mM N-acetyl cysteine (NAC), 1 mM BSO + 5 mM NAC, or 1 mM BSO + 5 μM UK5099 + 5 mM NAC. Viability measured by resazurin assay; n = 9–17 replicate wells.
(C) Clonogenic survival of Hepa1–6 cells treated with 5 μM UK5099, 1 mM BSO, 1 mM BSO + 5 μM UK5099, 10 mM NAC, 1 mM BSO + 10 mM NAC, or 1 mM BSO + 5 μM UK5099 + 10 mM NAC for 72 h. For statistical analysis, data were log-transformed before performing a one-way ANOVA; n = 8–12 replicates.
(D) Total glutathione (GSH) levels in Hepa1–6 cells treated with either DMSO or 5 μM UK5099 in the presence of absence of NAC for 48 h; n = 9 replicate wells.
(E and F) Monochlorobimane (mBCl) GSH assay in primary hepatocytes, 5 mM glucose (E), or 5 Mm glucose supplemented with 5 mM glutamine (F), treated with DMSO or 5 μM UK5099; n = 4–5 biological replicates.
Data are presented as mean ± SEM, compared by t test unless otherwise noted (*p < 0.05, **p < 0.01, ***p < 0.001). See also Figure S4.

