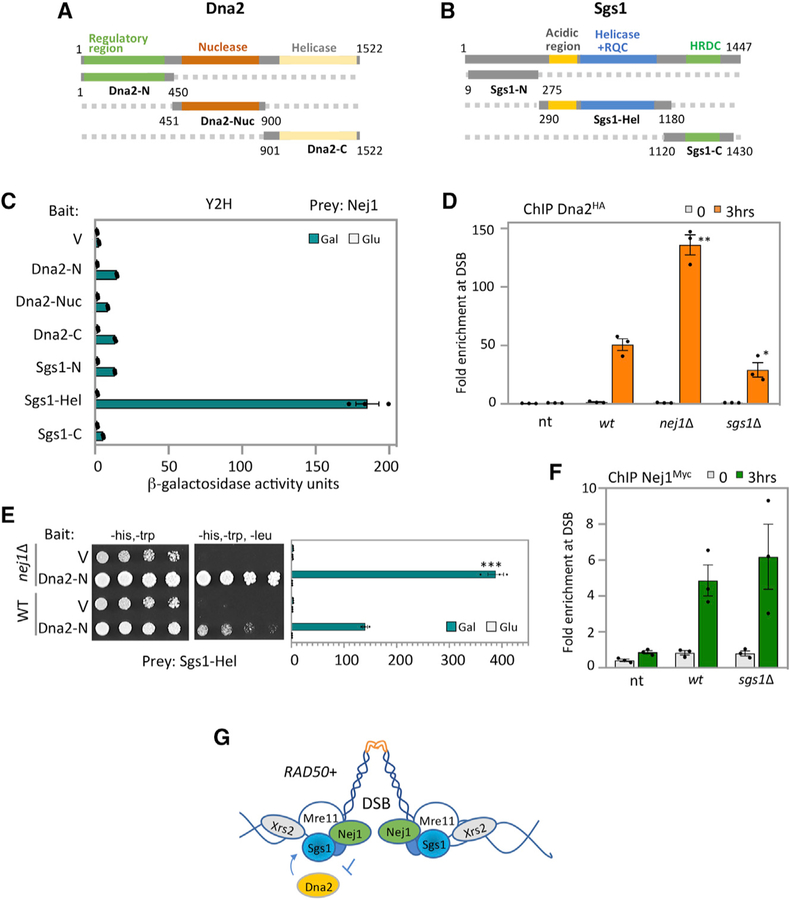
Figure 4. Nej1 Regulates Dna2 Recruitment to DSB.
(A) Schematic representation of Dna2 and its functional domains. In green is the N-terminal region, in red is the nuclease domain, and in yellow is in the C-terminal helicase domain.
(B) Schematic representation of Sgs1 and its functional domains. In gray is the N-terminal region, in blue is the helicase domain, and in green is in the C-terminal helicase and RNaseD C-terminal (HRDC) domain.
(C) Y2H analysis between Nej1 fused to HA-AD and either Dna2 or Sgs1 fragments fused to LexA-DBD. All constructs are under galactose induction (as shown in Figure S6), and quantitative β-galactosidase assays were performed as described in STAR Methods.
(D) Enrichment of Dna2HA at DSB, at 0- and 3-h time points, in WT (JC-4117), sgs1Δ (JC-4502), and no tag control (JC-727) were determined at 0.6 kb from DSB.
(E) Y2H analysis between Sgs1-Hel fused to HA-AD and Dna2-N fused to LexA-DBD was performed in WT cells (JC-1280) and in isogenic cells with nej1Δ (JC-4556) using a quantitative β-galactosidase assay and a drop assay on drop-out (-His, -Trp,-Leu) selective media plates.
(F) Enrichment of Nej1Myc at DSB, at 0and 3-h time points, in WT (JC-1687), nej1Δ (JC-4118), sgs1Δ (JC-4528), and no tag control (JC-727) were determined at 0.6 kb from DSB. Analysis was performed in triplicate from at least three biological replicate experiments. Statistical analysis is described in STAR Methods.
(G) Model showing Nej1 interacts with Mre11 and Sgs1. Nej1 inhibits the recovery of Dna2 at the DSB, which also interacts with both of these factors.

