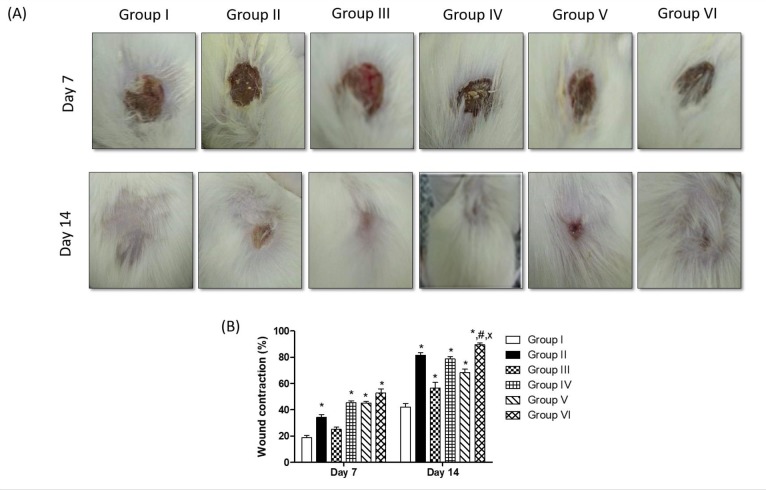
Fig 3.
(A) Representative photographs showing wound closure in rats with topical application of different treatments on day 7 and day 14. (B) Effects of different treatments on percent wound closure on different days in rats (wound contraction, %). Values are given as mean ± SEM (n = 6). *, #, x indicates p<0.05, compared to Group I, IV and V, respectively. Results were analyzed using one-way ANOVA followed by Tukey’s test.

