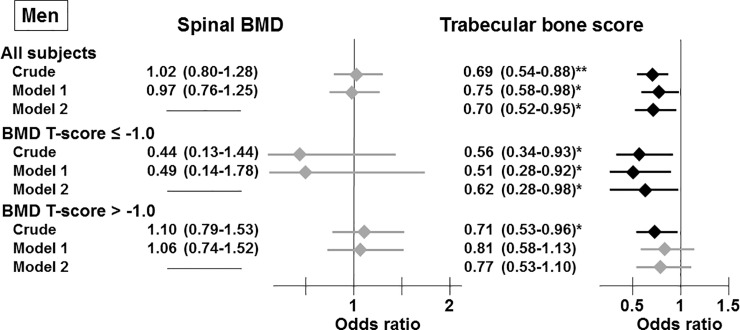
Fig 2. Associations between the presence of vertebral fractures and spinal BMD and TBS in all participants and the subgroups stratified by spinal BMD T-scores in men.
Odds ratios are presented as a 1 SD increase in spinal BMD and TBS. Model 1: adjusted for age, the duration of T2DM, and phosphate levels. Model 2: adjusted for the factors included in Model 1 and spinal BMD. *, P < 0.05; **, P < 0.01.

