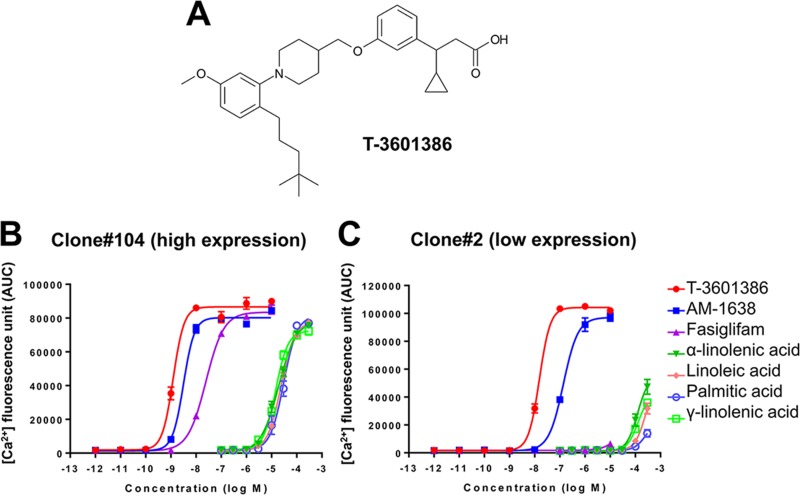
Fig 1. Chemical structure of T-3601386 and in vitro activities in CHO cells.
(A) The chemical structure of T-3601386. (B, C) Intracellular Ca2+ concentrations were measured before and after adding samples using FLIPR in CHO cells with high (clone#104) (B) and low expression (clone#2) (C) of human FFAR1. Each data point represents the mean ± S.E. (quadruplicate). Comparable results were obtained by another independent experiment.

