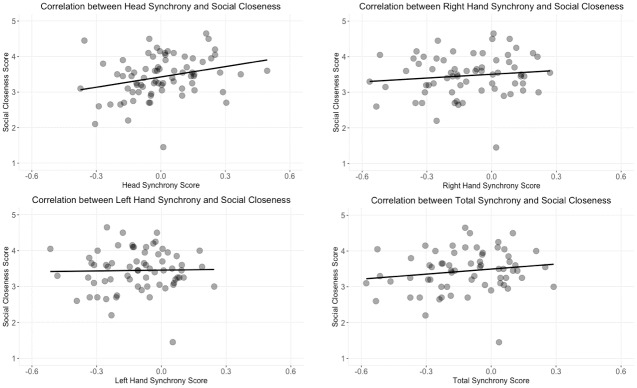
Fig 18. Synchrony and social closeness.
This figure shows the correlation between synchrony scores from different body regions and social closeness. The top left plot shows the relationship with head synchrony; top right plot shows the relationship with total synchrony; the bottom left plot shows the relationship with left hand synchrony; the bottom right plot shows the relationship with right hand synchrony.

