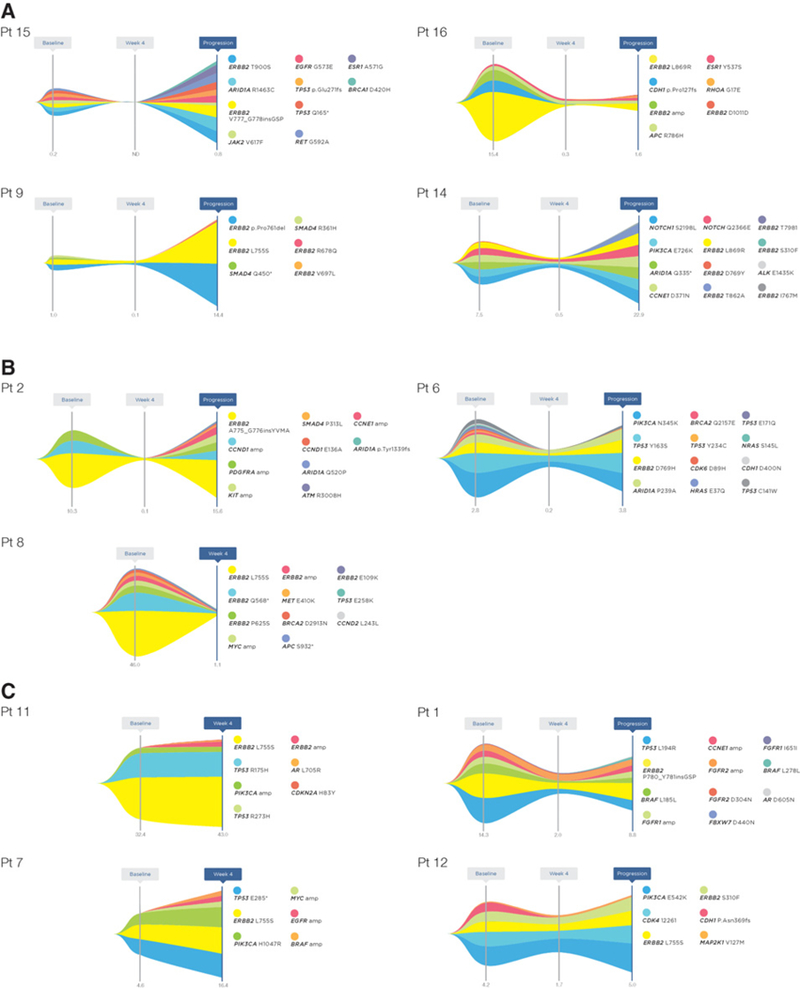
Figure 3.

Variant allele frequency maps of ctDNA-detected mutations in individual patients in response to neratinib treatment. Variant allele frequencies (VAFs) of ctDNA-detected mutations over time are shown for the 11 patients with detectable HER2 mutation at baseline and with available blood samples at subsequent time points (n = 11 at 4 weeks, and n = 8 at progression). A includes four patients who achieved clinical benefit (CR in Pt 15, PR in Pt 9, SD ≥24 weeks in Pts 16 and 14). B, three patients who had best response of SD but lasted less than 24 weeks (Pt 2, Pt 6, and Pt 8). C, four patients who had PD as the best response (Pt 11, Pt 7, Pt 1, and Pt 12). Numbers at the bottom of each graph represent the VAFs of the HER2 mutation colored in yellow, which were also used to plot Fig. 2D. All ctDNA alterations are shown except for patients 14 and 6 due to space limits in the figure. The complete list of mutations and their VAFs is detailed in Supplementary Table S3.
