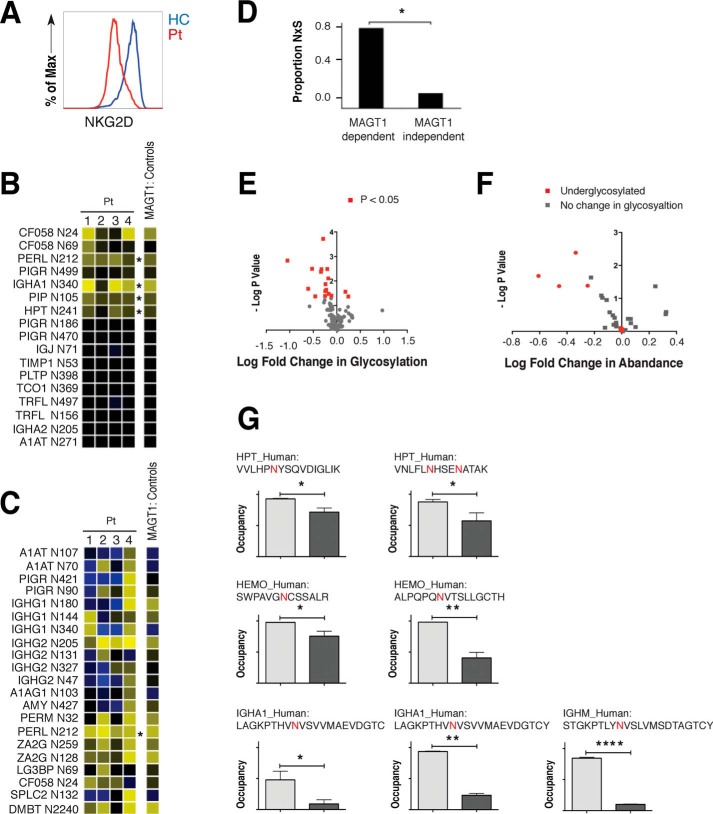
Figure 3.
Defective glycosylation in XMEN patient cells. A, flow cytometry analysis of surface expression of NKG2D in cycling T cells from an XMEN patient (Pt) and HC. B, ratio of salivary protein glycosylation site occupancy in XMEN patients after PNGase F and trypsin digestion relative to their HC parents. The N-linked glycosylation site corresponding to each row is indicated at left. C, ratio of salivary protein glycosylation site occupancy in XMEN patients after PNGase F and AspN digestion. B and C; yellow, decreased glycosylation; black, no change in glycosylation; blue, increased glycosylation; *, p < 0.05. D, proportion of the NXS sequons in MAGT1-dependent and -independent glycosylation sites. *, p = 0.02. E, volcano plot of the log fold change in glycosylation versus the negative log of the p value. F, volcano plot of the log fold change in abundance versus the negative log of the p value. G, underglycosylation of glycosites in particular plasma proteins in XMEN patients. *, p < 0.05; **, p < 0.01; ****, p < 0.001.

