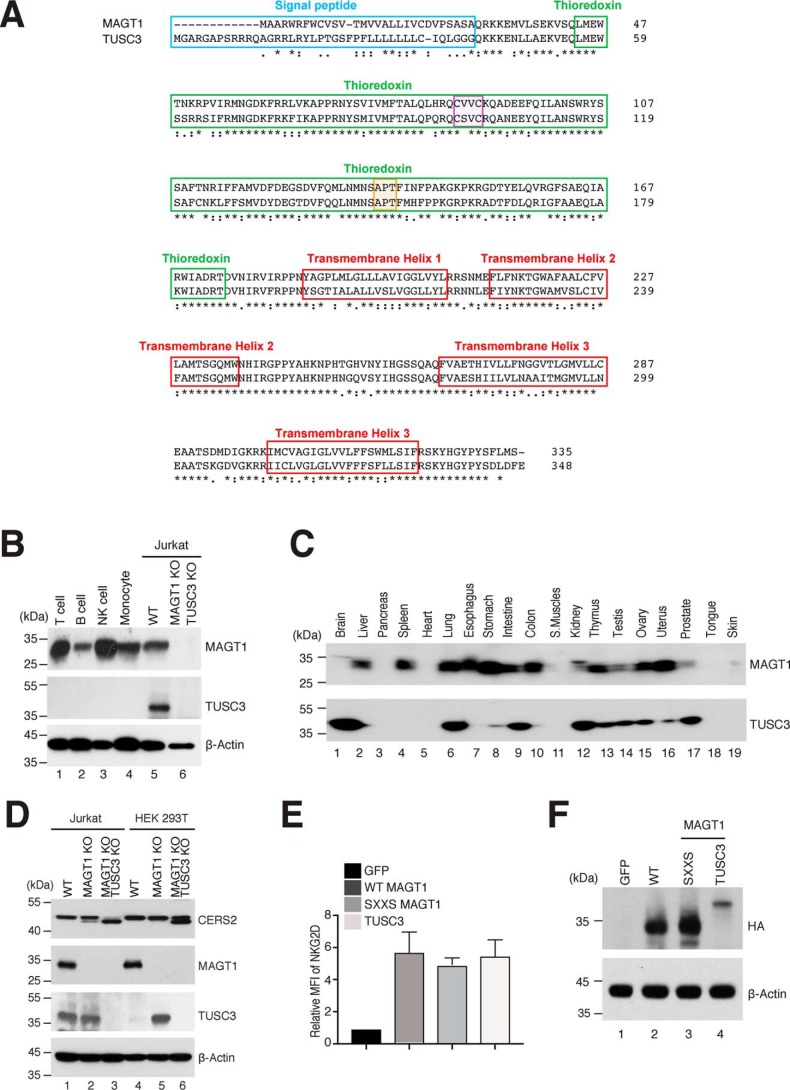
Figure 4.
Molecular structure and biochemical characteristic of MAGT1 and TUSC3. A, comparison of the amino acid sequences of MAGT1 and TUSC3. The signal peptide, TRX domain, and transmembrane regions are highlighted in blue, green, and red, respectively. The CXXC and cis-proline motifs are highlighted in purple and orange, respectively. B, representative Western blot analysis showing MAGT1 and TUSC3 expressions in isolated primary human T cells, CD19+ B cells, CD56+ NK cells, CD14+ monocytes as well as Jurkat lines that are WT or harbor CRISPR KOs of both MAGT1 and TUSC3 (MAGT1/TUSC3 KO). C, immunoblotting of MAGT1 and TUSC3 expression in a commercially-prepared human tissue sample membrane. D, representative Western blot analysis of CERS2, MAGT1, TUSC3, and β-actin (loading control) in MAGT1 KO and MAGT1/TUSC3 KO from Jurkat and HEK 293T cells. E, quantification of the mean fluorescent intensity (MFI) of surface NKG2D in MAGT1 KO and MAGT1/TUSC3 KO from Jurkat and HEK 293T cells. Cells were transfected with mRNA encoding HA-tagged versions of GFP, WT MAGT1, the thioredoxin domain mutant of MAGT1 (SXXS), or WT TUSC3 along with NKG2D/DAP10-encoding plasmids. Error bars represent the standard error of the mean of three independent experiments; p values were calculated with a paired t test. F, representative Western blot analysis of MAGT1 and TUSC3 expression in transfected MAGT1/TUSC3 KO HEK 293T cells. The expressions of MAGT1 and TUSC3 were probed by HA antibody with actin as a loading control.

