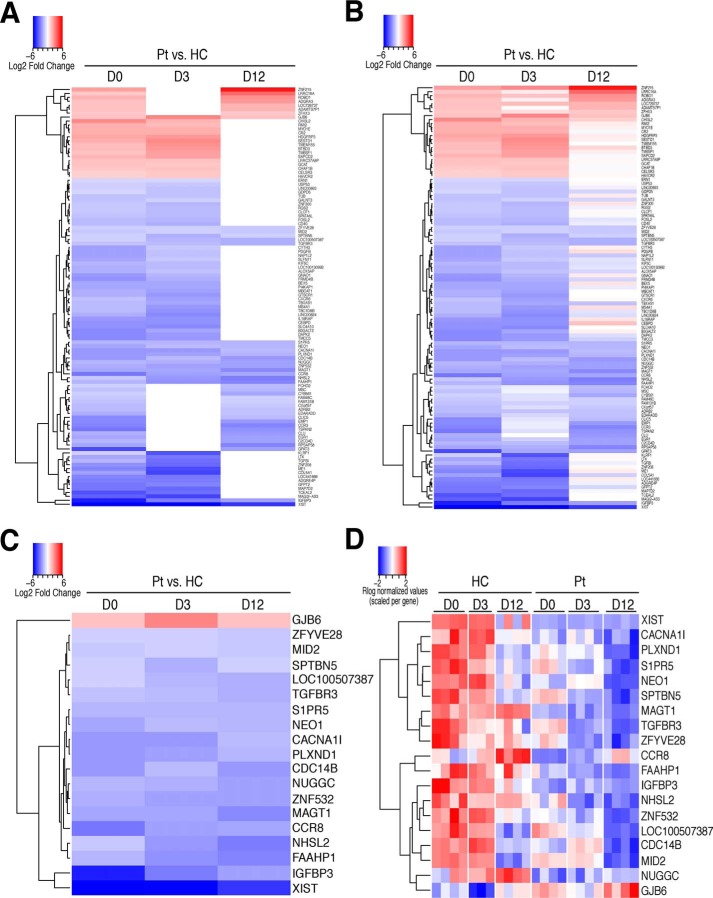
Figure 7.
Differentially expressed genes in CD8+ T cells from XMEN and healthy controls present in multiple time points. A and B, heatmap of log2 fold change for XMEN patients versus HCs for DEGs found in at least two time points (n = 106 genes). A, heatmap showing only data passing significance threshold of adjusted p value <0.05 and log2 ratio >1. B, heatmap corresponding to A showing all data points (including nonsignificant values) to illustrate trends in direction of expression of genes across time points. C and D, heatmap of log2 fold change (C) and Rlog normalized counts for DEGs (D) found in all three time points (n = 19). For all heatmaps, up-regulated expression is red, and down-regulated expression is blue.

