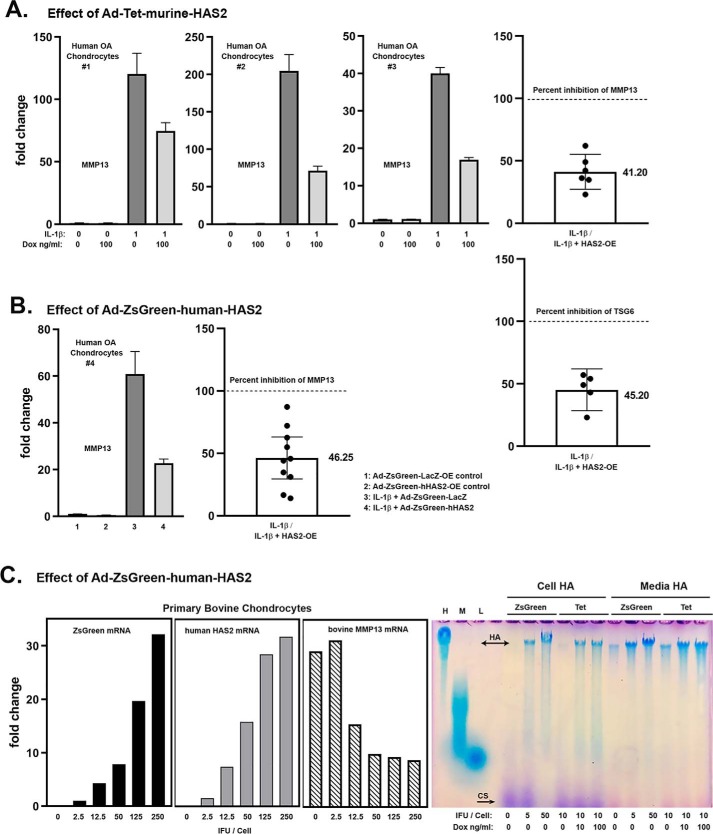
Figure 1.
A, three examples of independent human OA chondrocyte cultures transduced with Ad-Tet-murine-mycHAS2 and subsequently treated with 1 ng/ml IL1β and Dox as labeled, analyzed for changes in MMP13 mRNA. The right-hand bar graphs depict the mean ± 95% confidence interval (error bars) of independent experiments showing the -fold change in MMP13 (n = 6) and TSG6 (n = 5) mRNA due to HAS2-OE (percent inhibition) relative to values with IL1β treatment (without Dox) set to 100% (dotted line). The actual mean value is shown beside the bar. B, a representative example of human OA chondrocytes transduced with Ad-ZsGreen-human-HAS2 (bars 2 and 4) or Ad-ZsGreen-LacZ (bars 1 and 3) and subsequently treated with 10 ng/ml IL1β (bars 3 and 4). The adjacent bar graph depicts the mean ± 95% confidence interval of independent experiments showing the -fold change in MMP13 mRNA (n = 10) due to HAS2-OE (percent inhibition) relative to values with IL1β treatment set to 100% (dotted line). C, a representative example of bovine articular chondrocytes transduced with varying concentrations (IFU/cell) of Ad-ZsGreen-human-HAS2, followed by treatment with 10 ng/ml IL1β and then analyzed for changes in ZsGreen, human HAS2, and bovine MMP13 mRNA. In the adjacent panel, aliquots of proteinase K–treated media and cell lysates from human chondrocytes transduced with Ad-ZsGreen-human-HAS2 (ZsGreen) or Ad-Tet-murine-mycHAS2 (Tet) were analyzed on a 1.0% agarose electrophoresis sizing gel stained with DMMB. Lane markers denote a 1.0 mg/ml aliquot of HA of 1200–1800 kDa (H); HA of 180–350 kDa (M), and HA of <5 kDa (L).

