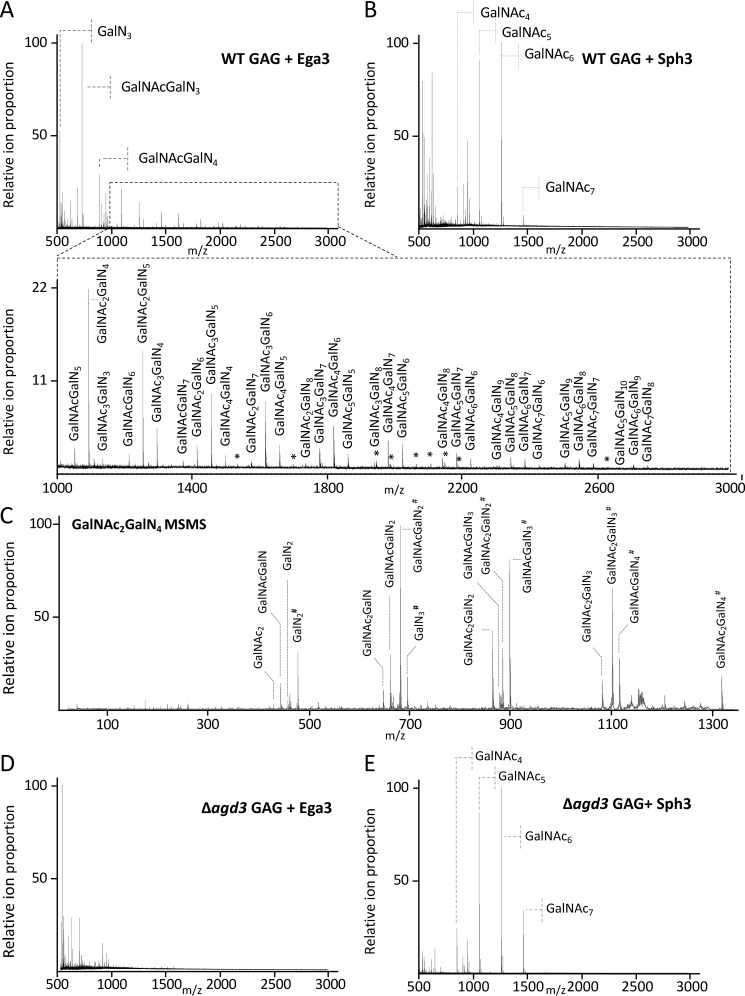
Figure 4.
Ega3 is specific for GalN-containing regions of GAG. MALDI-TOF MS spectra of oligosaccharide products released by treatment of secreted GAG from WT A. fumigatus after treatment with 1 μm Sph3 (A) or 1 μm Ega3 (B) are shown. C, MS-MS spectra of the reduced and propionylated tetra-deacetylated galactosamine hexasaccharide species produced from Ega3 treatment. Ions are labeled with their monosaccharide composition, with the numerical subscript indicating the number of sugar units present, and # indicates the reducing end of the oligosaccharide., MALDI-TOF MS spectra of secreted GAG purified from the A. fumigatus Δagd3 mutant after treatment with 1 μm Ega3 (D) or Sph3 (E). All ions corresponding to oligosaccharides are labeled with monosaccharide composition or with an asterisk for the low intensity ions.

