Figure 6.
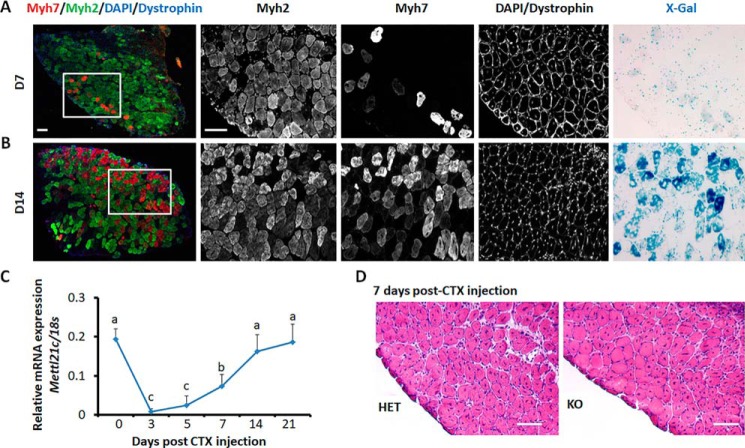
Expression of Mettl21c during muscle regeneration. A and B, immunostaining of Myh7 (red), Myh2 (green), and dystrophin (blue), and X-Gal staining of serial sections of SOL muscles at day 7 (A) and day 14 (B) after CTX injection. Scale bar: 100 μm. C, qPCR analysis of Mettl21c at different days during SOL muscle regeneration. Error bars represent mean + S.D. of six mice with three technical repeats. Different letters indicates p < 0.05 (one-way ANOVA). D, H&E staining of SOL muscles from HET and KO mice 7 days after CTX injection. Scale bar: 100 μm.

