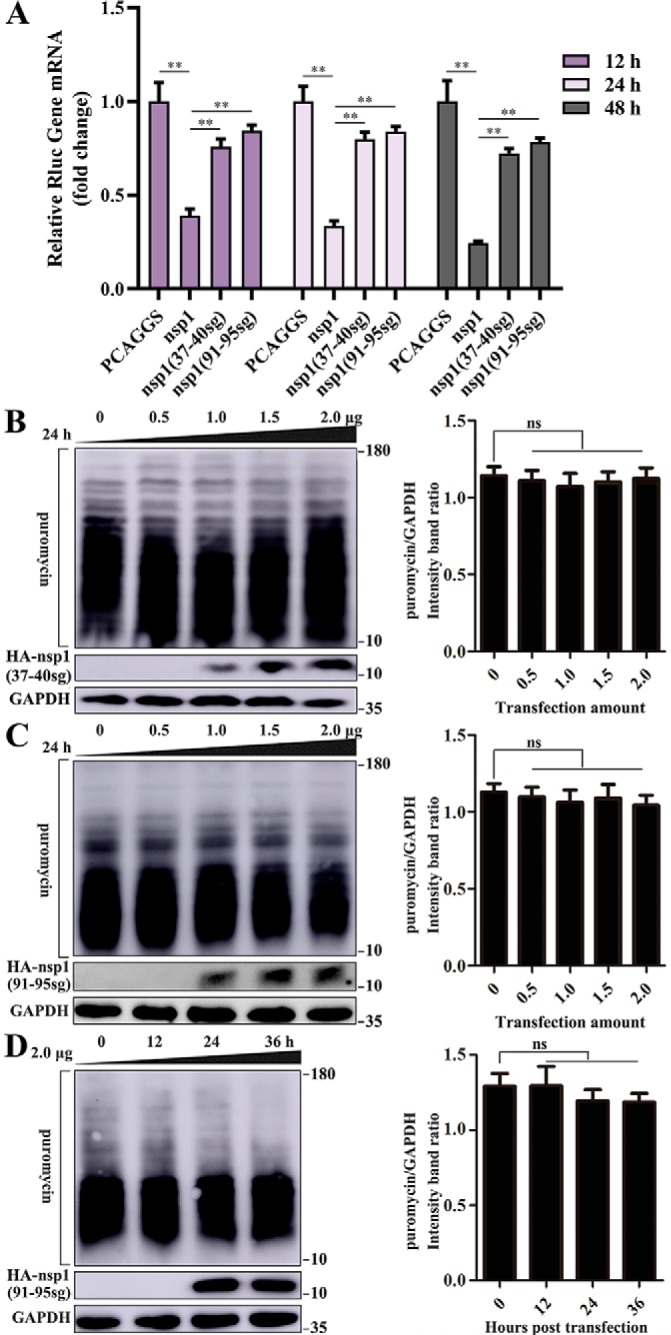
Figure 3.

The motif comprising amino acids 91–95 is a critical region for TGEV nsp1-induced inhibition of host protein synthesis. A, HEK-293T cells were cotransfected with pRL-SV40 encoding the Rluc reporter gene downstream of the SV40 promoter and one of the following plasmids: PCAGGS, PCAGGS-TGEV-nsp1-HA, PCAGGS-TGEV-nsp1(37–40sg)-HA, and PCAGGS-TGEV-nsp1(91–95sg)-HA, which encode no gene, TGEV nsp1, TGEV nsp1(37–40sg), and TGEV nsp1(91–95sg), respectively. At 12, 24, and 48 h post-transfection, the cells were lysed and subjected to real-time quantitative PCR analysis. The values of TGEV nsp1, TGEV nsp1(37–40sg), and TGEV nsp1(91–95sg) were normalized to those of the untreated empty vector (PCAGGS) control, which were set to 1. B, HEK-293T cells were transfected with different doses of the TGEV nsp1(37–40sg) plasmid (0–2.0 μg) for 24 h. The cells were pulsed with 3 μm puromycin for 1 h at 37 °C and then subjected to Western blot analysis (left). The grayscale values of the protein bands were analyzed by ImageJ (right). C, cells were transfected with different doses of the TGEV nsp1(91–95sg) plasmid (0–2.0 μg) for 24 h. The cells were pulsed with 3 μm puromycin for 1 h at 37 °C and then subjected to Western blot analysis (left). The grayscale values of the protein bands were analyzed by ImageJ (right). D, the cells were pulsed with 3 μm puromycin for 1 h after transfection for 0, 12, 24, and 36 h (left) and then subjected to Western blot analysis (right). The grayscale values of the protein bands were analyzed by ImageJ. Data are represented as mean ± S.D., n = 3. **, p < 0.01; ns, not significant.
