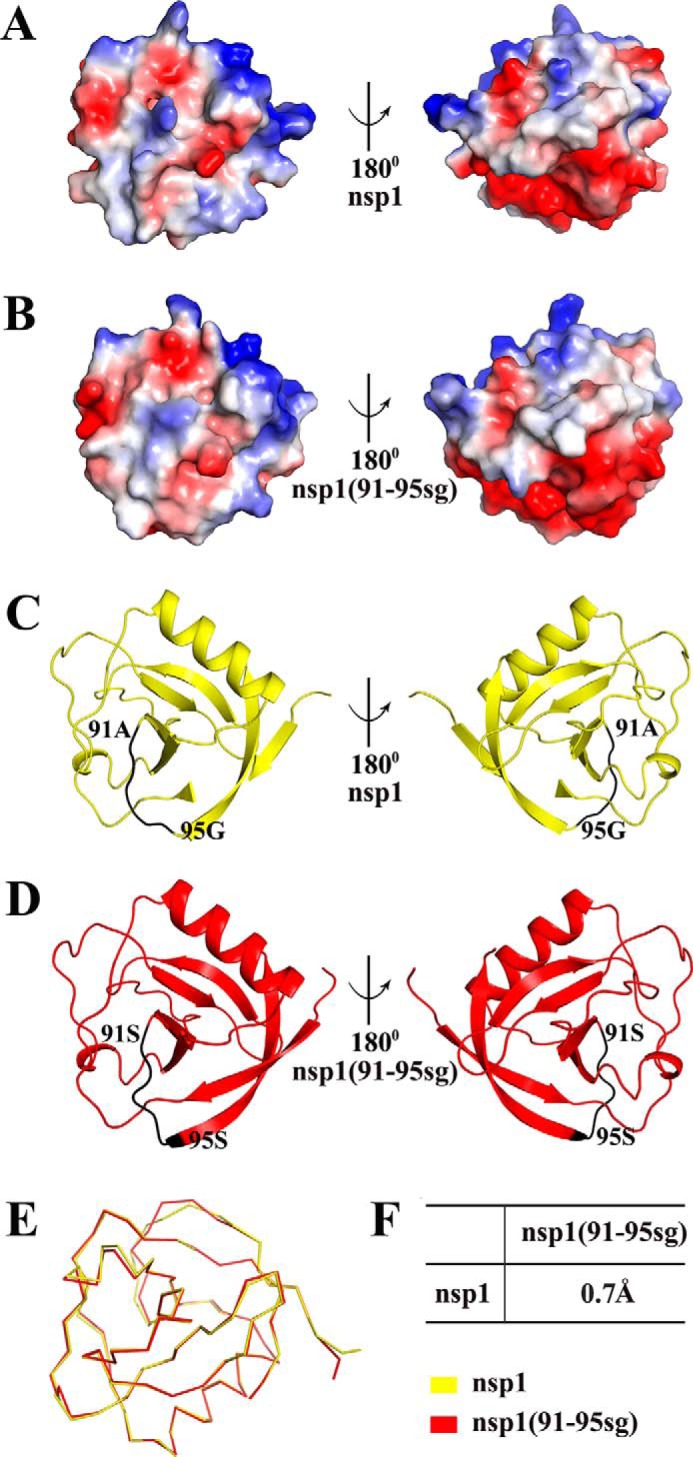
Figure 4.

Structural comparisons of TGEV nsp1 and TGEV nsp1(91–95sg). A, views from opposite sides of the electrostatic surface of TGEV nsp1. B, views from opposite sides of the electrostatic surface of TGEV nsp1(91–95sg). Positive charges are shown in blue, and negative charges are shown in red. C, views from opposite sides of a cartoon model of TGEV nsp1 with the motif (amino acids 91–95) marked in black. D, views from opposite sides of a cartoon model of TGEV nsp1(91–95sg) with the motif (amino acids 91–95) marked in black. TGEV nsp1 is shown in yellow, and TGEV nsp1(91–95sg) is shown in red. E, ribbon diagrams of the two structures. F, r.m.s.d. values between TGEV nsp1 and TGEV nsp1(91–95sg). The r.m.s.d. values were calculated using PDBeFold.
