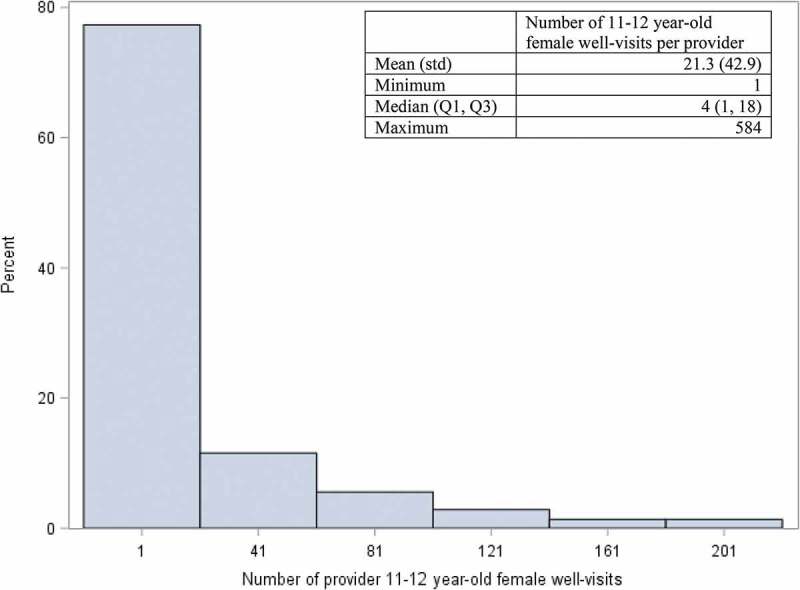
Figure 2.

Distribution* of 11–12 year-old female well visits among providers with ≥1 well-visit in a regional health plan, January 1, 2008- April 30, 2015 (n = 5,086 providers).
*The graph is truncated. The maximum number of well-visits per provider was 584.
