
Figure 5.
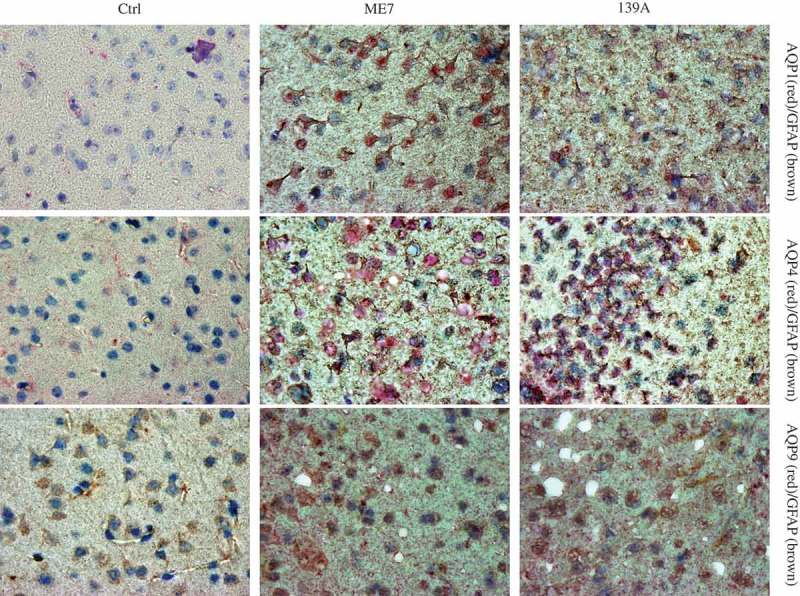
Co-distribution of AQPs signals with GFAP signals in the brain slices of 139A- and ME7-infected mice. Representative images of GFAP signals visualized by incubation with DAB (brown) and AQPs signals developed by incubation of permanent red (red). The brain slices of age-matched normal mice were used as the control. The preparations reacted with the antibodies of AQP1, AQP4 and AQP9 are showed in upper, middle and low panels, respectively. (×100).