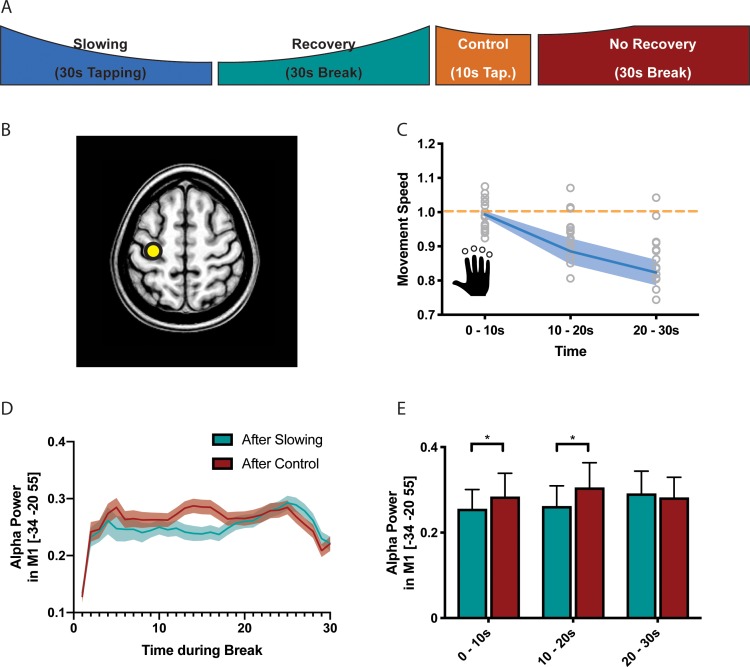
Figure 5. Results of the electroencephalography (EEG) experiment (N = 17).
(A) Participants performed slowing (30 s) or control (10 s) sequence tapping followed by a break of 30 s while EEG was measured. (B) Source localisation was performed using eLoreta and fluctuations of alpha power extracted from primary sensorimotor cortex (SM1). (C) Motor slowing during the behavioural task (blue line) normalised to control condition (orange line). (D) Power over time during breaks after tapping (green = break after slowing tapping, red = break after control tapping, dotted lines = sem.). (E) Same as (D), binned in 10 s blocks for statistical analysis. All values mean ± sem. *p<0.05.

