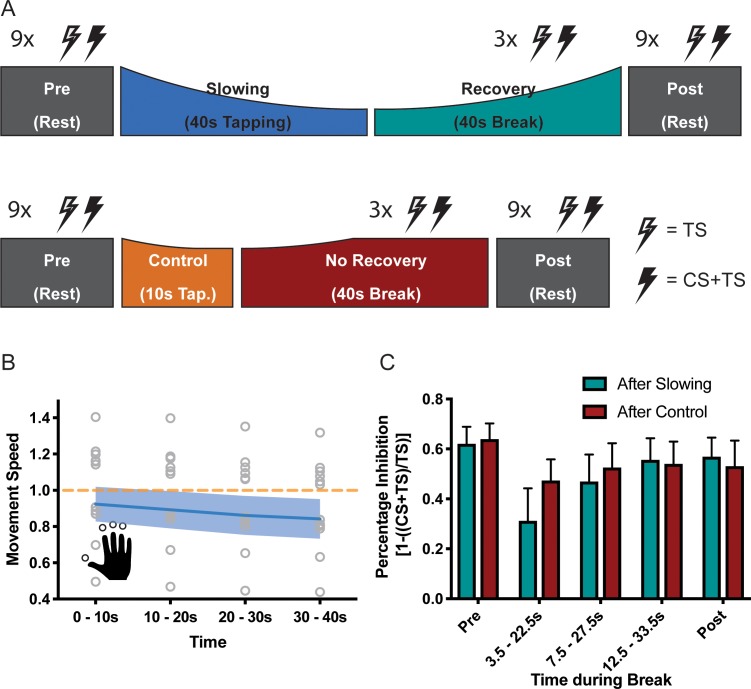
Figure 6. Results of the short latency intracortical inhibition (SICI) experiment (N = 13).
(A) SICI was measured before (Pre) and after (Post), as well as during the break after either slowing (40 s) or control (10 s) tapping. (B) Motor slowing during the behavioural task (blue line) normalised to control condition (orange line). Note that in this experiment the two conditions were tested on two different days, therefore, there was a difference in initial speed across sessions. (C) Percentage Inhibition of primary motor cortex before (Pre), for the first (0–10 s), second (10–20 s) and third (20–30 s) conditioning stimulus during the break, and at the end of the session (Post) where participants executed either the slowing (green) or control (red) tapping condition. It can be seen that slowing leads to disinhibition of primary motor cortex immediately after tapping. All values mean ± sem.

