. 2019 Aug 19;8:e45594. doi: 10.7554/eLife.45594

Figure 1. Age-stratified, IgG distributions among a longitudinal cohort of 142 children ages birth to 11 years in Leogane, Haiti, 1990 – 1999.

IgG response measured in multiplex using median fluorescence units minus background (MFI-bg) on the Luminex platform in 771 specimens, marked with rug plots below each distribution. Vertical lines mark seropositivity cutoffs are based on ROC analyses (solid), finite Gaussian mixture models (heavy dash), or distribution among presumed unexposed (light dash). Mixture models failed to converge for ETEC LT B subunit. Created with notebook (https://osf.io/dk54y) and data (https://osf.io/3nv98). Figure 1—figure supplement 1 shows similar distributions from the Tanzania study. Figure 1—figure supplement 2 contrasts Giardia VSP-3 distributions with trachoma pgp3 distributions. Figure 1—figure supplement 3 shows distributions from the Kenyan cohort.

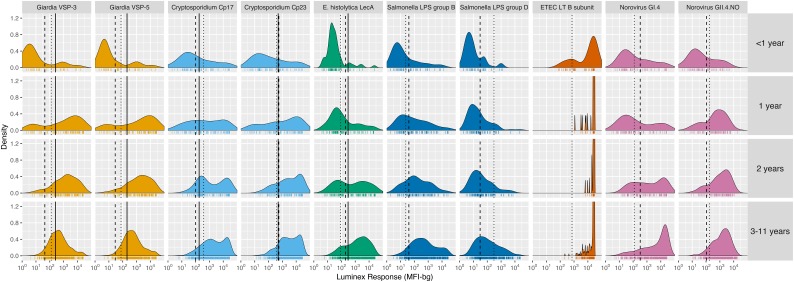
Figure 1.

Figure 1—figure supplement 1. Age-stratified, IgG distributions among 4989 children ages 1 to 9 years old in Kongwa, Tanzania, 2012−2015.

Figure 1—figure supplement 1.

IgG response measured in multiplex using median fluorescence units minus background (MFI-bg) on the Luminex platform, marked with rug plots below each distribution. Vertical lines mark seropositivity cutoffs based on ROC analyses (solid) and finite Gaussian mixture models (heavy dash). Mixture models failed to converge for all antibody distributions except for Giardia and E. histolytica. Created with notebook (https://osf.io/dt9zu) and data (https://osf.io/kv4d3).
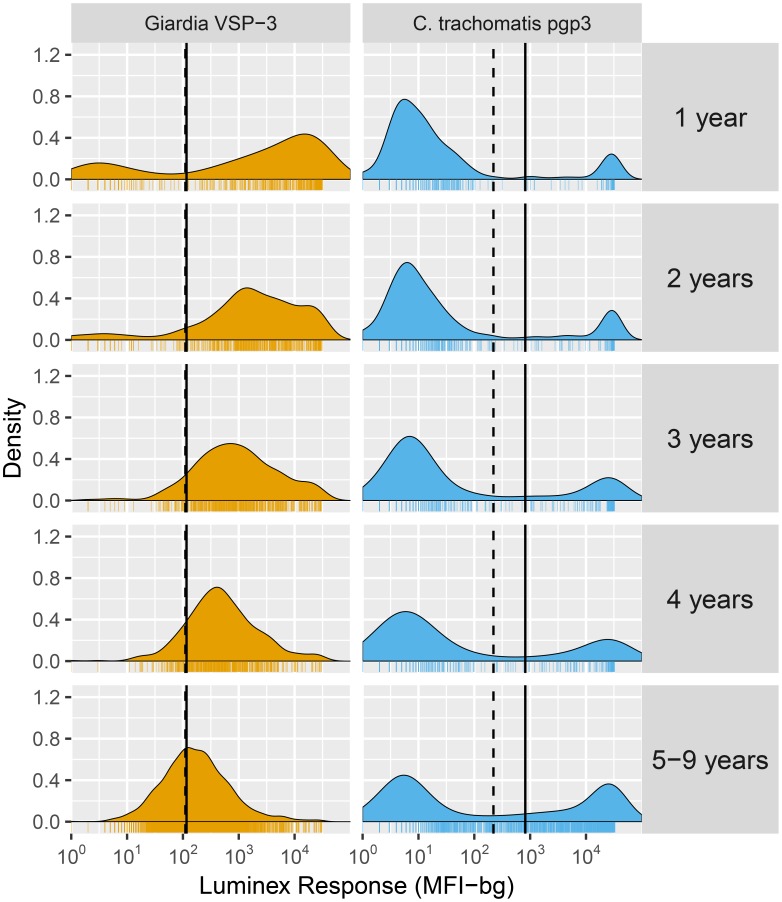
Figure 1—figure supplement 2. Contrasting age-dependent changes in distributions of IgG levels to Giardia VSP-3 and Chlamydia trachomatis pgp3 antigens among 4989 children ages 1 to 9 years old in Kongwa, Tanzania, 2012 – 2015.

Figure 1—figure supplement 2.

IgG response measured in multiplex using median fluorescence units minus background (MFI-bg) on the Luminex platform, marked with rug plots below each distribution. Vertical lines mark seropositivity cutoffs based on ROC analyses (solid) and finite Gaussian mixture models (dash). Created with notebook (https://osf.io/dt9zu) and data (https://osf.io/kv4d3).
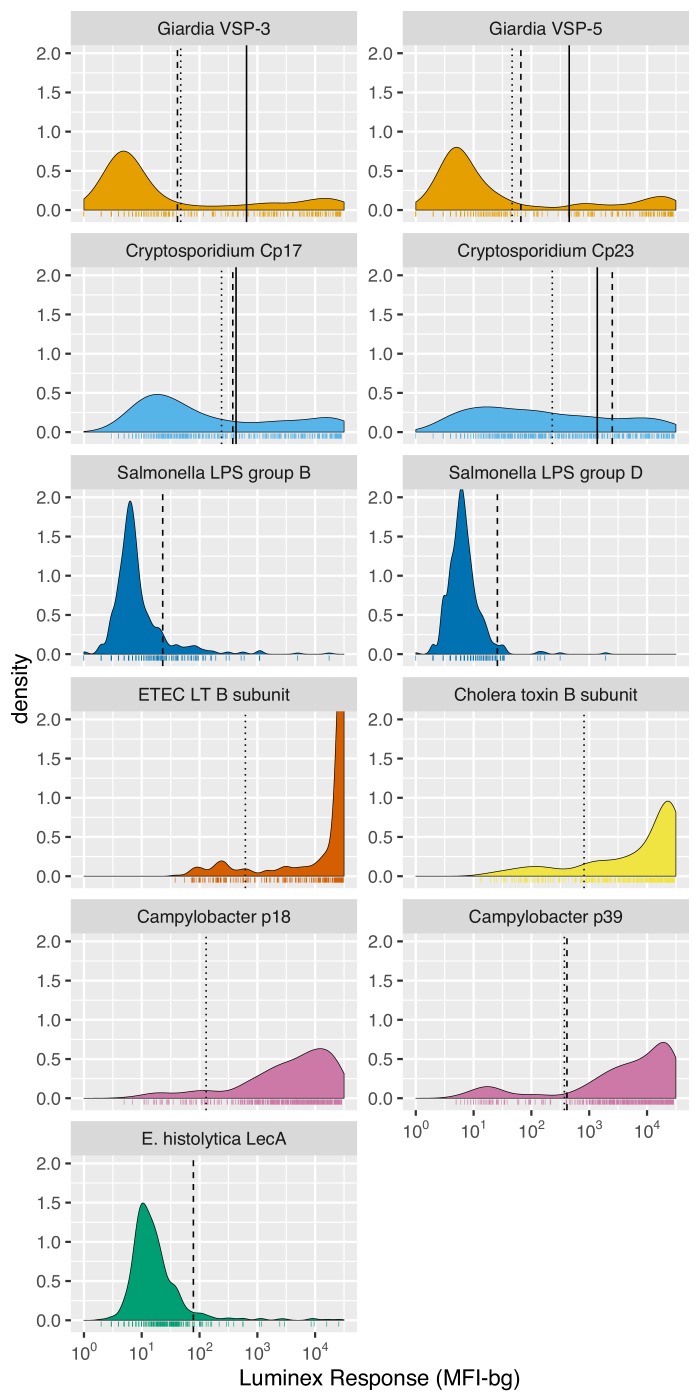
Figure 1—figure supplement 3. IgG distributions among children ages 4 to 17 months old in Asembo, Kenya, 2013.

Figure 1—figure supplement 3.

IgG response measured in multiplex using median fluorescence units minus background (MFI-bg) on the Luminex platform. N = 439 samples from 240 children, marked with rug plots below each distribution. Vertical lines mark seropositivity cutoffs based on ROC analyses (solid), finite Gaussian mixture models (heavy dash), or distribution among presumed unexposed (light dash). Mixture models failed to converge for ETEC LT B subunit and Campylobacter p18. Created with notebook (https://osf.io/456jp) and data (https://osf.io/2q7zg).