. 2019 Aug 19;8:e45594. doi: 10.7554/eLife.45594

Figure 3. Age dependent mean IgG and seroprevalence in Haiti.

Geometric means (A) and seroprevalence (B), estimated with cubic splines among children ages birth to 10 years in Leogane, Haiti 1990–1999. Shaded bands are approximate, simultaneous 95% confidence intervals. IgG response measured in multiplex using median fluorescence units minus background (MFI-bg) on the Luminex platform (N = 771 measurements from 142 children). Created with notebook (https://osf.io/jeby3) and data (https://osf.io/3nv98). Data for some antigens measured among children < 5 years previously published (Arnold et al., 2017). Figure 3—figure supplement 1 includes similar curves from Kenya; Figure 3—figure supplement 2 includes similar curves from Tanzania.

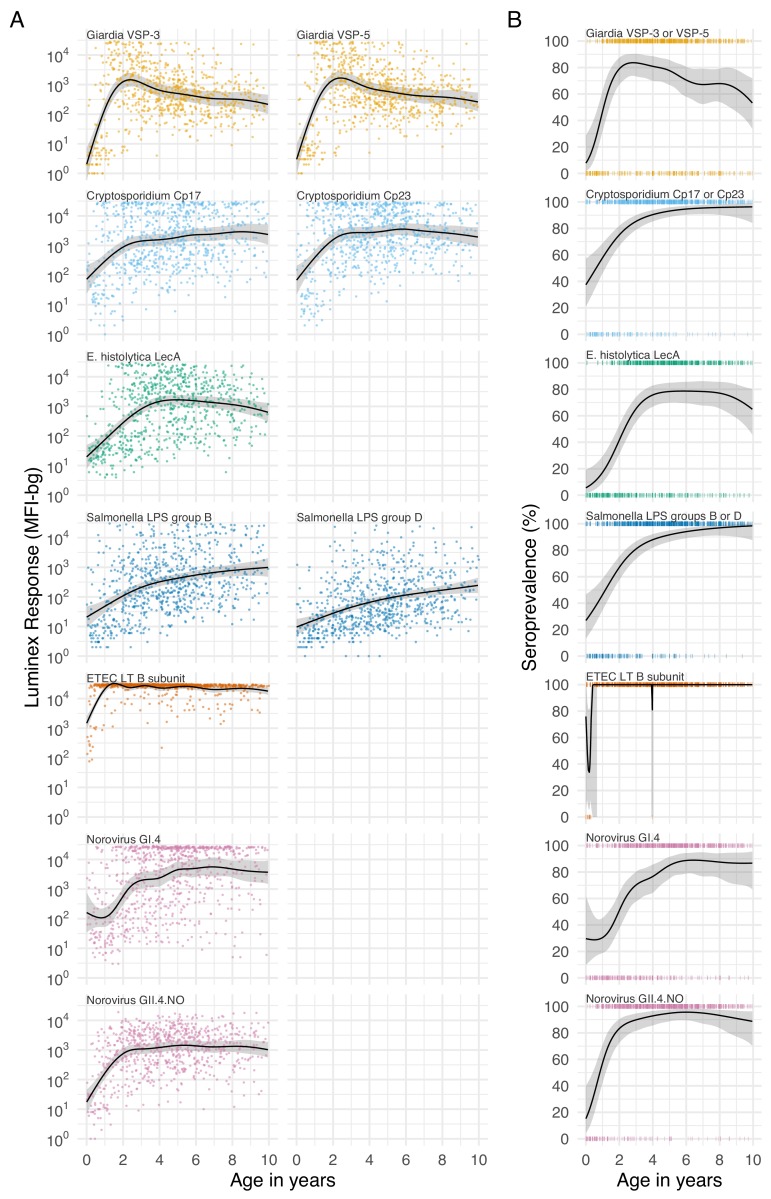
Figure 3.

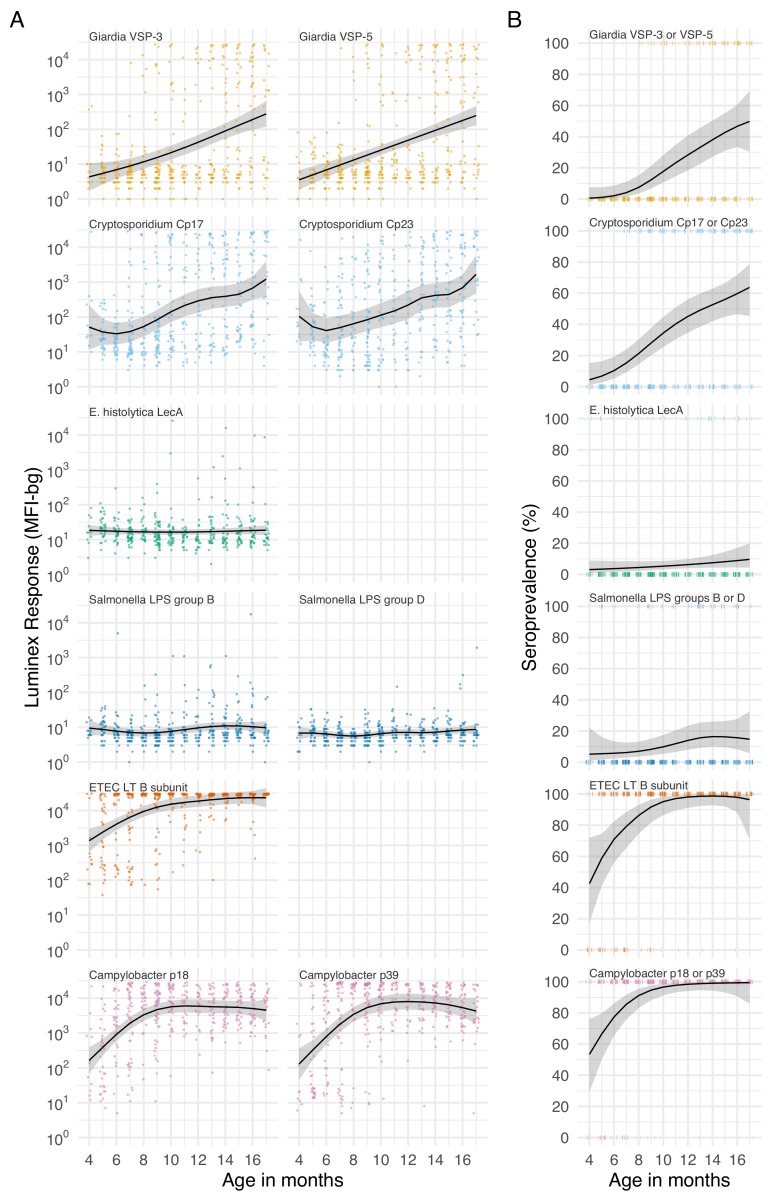
Figure 3—figure supplement 1. Age dependent mean IgG and seroprevalence in Kenya.

Figure 3—figure supplement 1.

Geometric means (A) and seroprevalence (B), estimated with cubic splines among children ages 4 to 17 months in Asembo, Kenya, 2013. Shaded bands are approximate, simultaneous 95% confidence intervals. Ages were measured in months completed (rounded) so points in the figure are jittered. IgG response measured in multiplex using median fluorescence units minus background (MFI-bg) on the Luminex platform (N = 439 measurements from 240 children). Created with notebook (https://osf.io/jeby3) and data (https://osf.io/2q7zg).
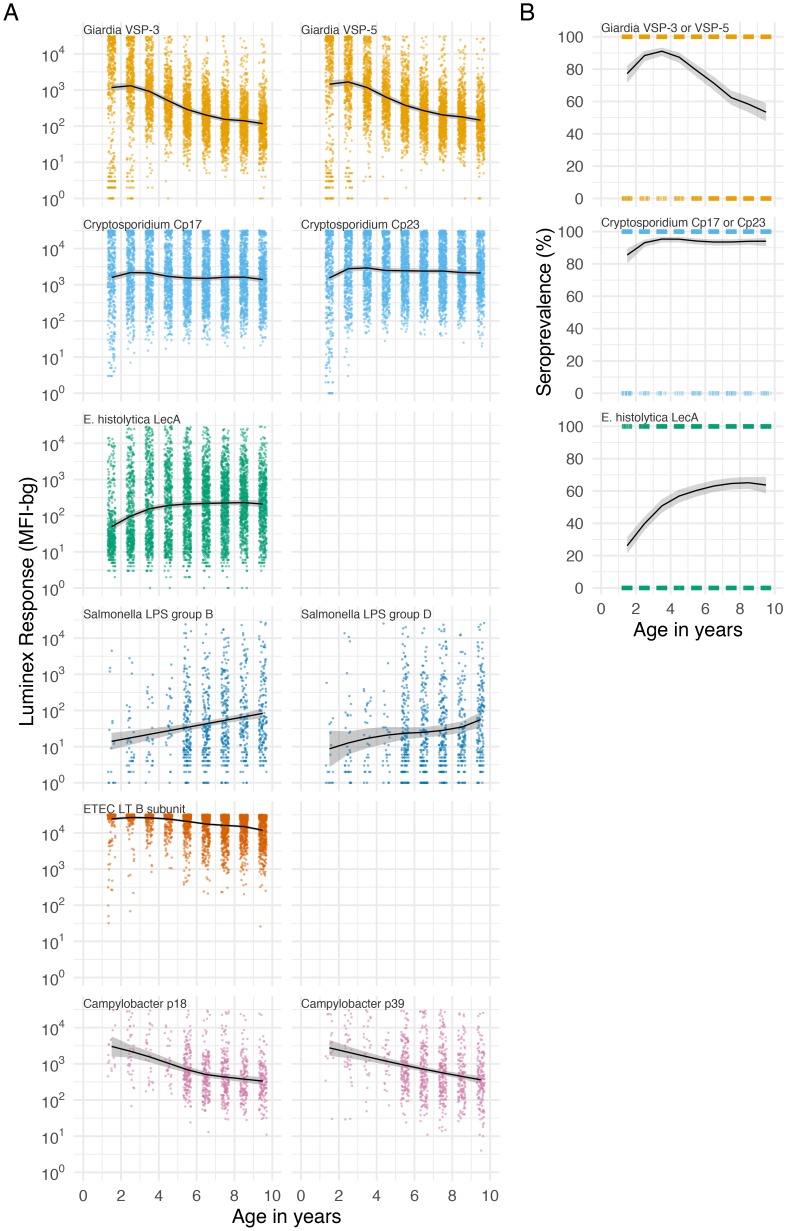
Figure 3—figure supplement 2. Age dependent mean IgG and seroprevalence in Tanzania.

Figure 3—figure supplement 2.

Geometric means (A) and seroprevalence (B), estimated with cubic splines among children ages 1 to 9 years in Kongwa, Tanzania, 2012–2015. Shaded bands are approximate, simultaneous 95% confidence intervals. Ages were measured in years completed (rounded) so points in the figure are jittered. IgG response measured in multiplex using median fluorescence units minus background (MFI-bg) on the Luminex platform in 4989 specimens. Salmonella and Campylobacter antigens were only included in the multiplex in 2012 (N = 902 specimens). Seropositivity cutoffs could not be estimated for bacterial pathogens in this study, so seroprevalence curves are not shown. Created with notebook (https://osf.io/jeby3) and data (https://osf.io/kv4d3).