. 2019 Aug 19;8:e45594. doi: 10.7554/eLife.45594

Figure 4. Longitudinal changes in IgG response over six repeated measurements among 142 children ages 0–11 years in Leogane, Haiti, 1990 – 1999.

Measurements were spaced by approximately 1 year (median spacing = 1, IQR = 0.7, 1.3). Horizontal dashed lines mark seropositivity cutoffs for each antibody. The number of children measured at each visit was: n1 = 142, n2 = 142, n3 = 140, n4 = 131, n5 = 111, n6 = 66); 29 children had >6 measurements that are not shown. IgG response measured in multiplex using median fluorescence units minus background (MFI-bg) on the Luminex platform. Created with notebook (https://osf.io/vyhra), which includes additional visualizations, and data (https://osf.io/3nv98). Figure 4—figure supplement 1 includes a similar figure from the Kenya cohort. Figure 4—figure supplements 2 and 3 summarize the proportion of children in each category across measurement rounds in Haiti and Kenya.

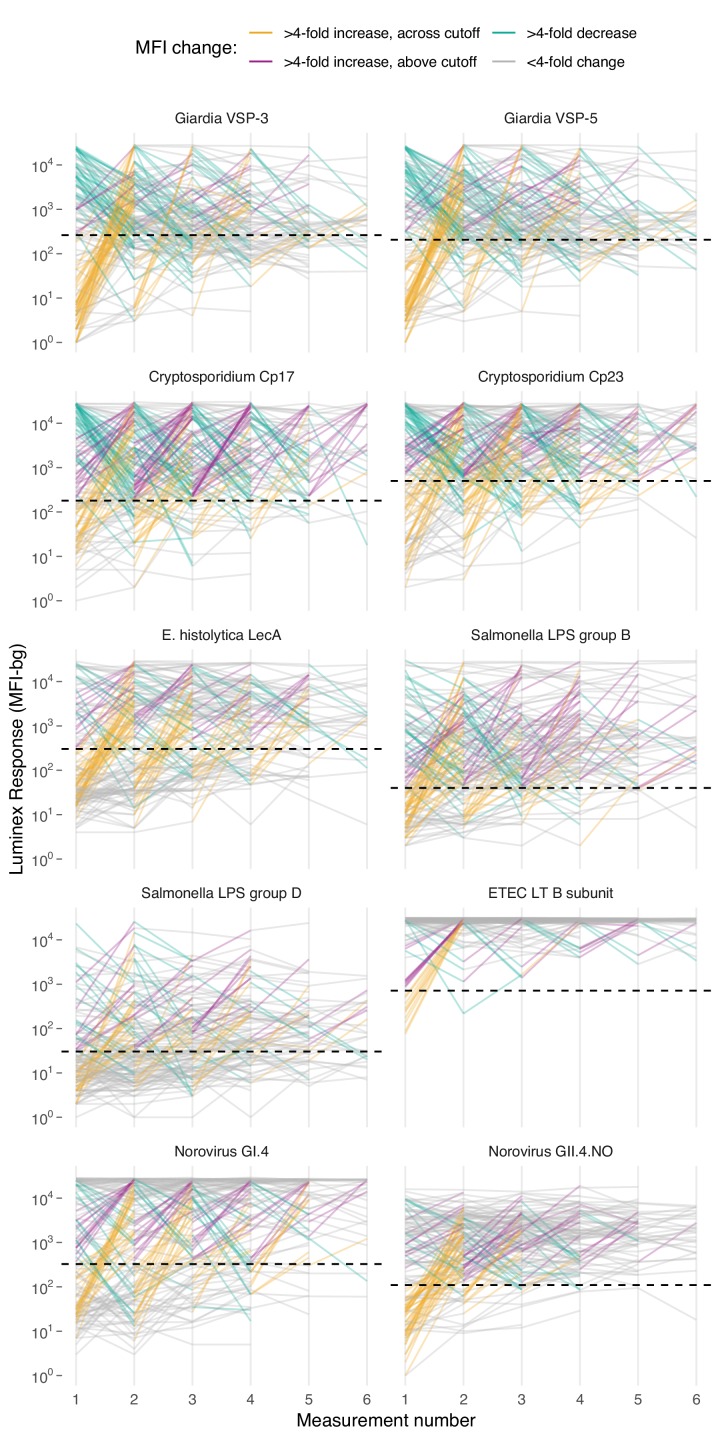
Figure 4.

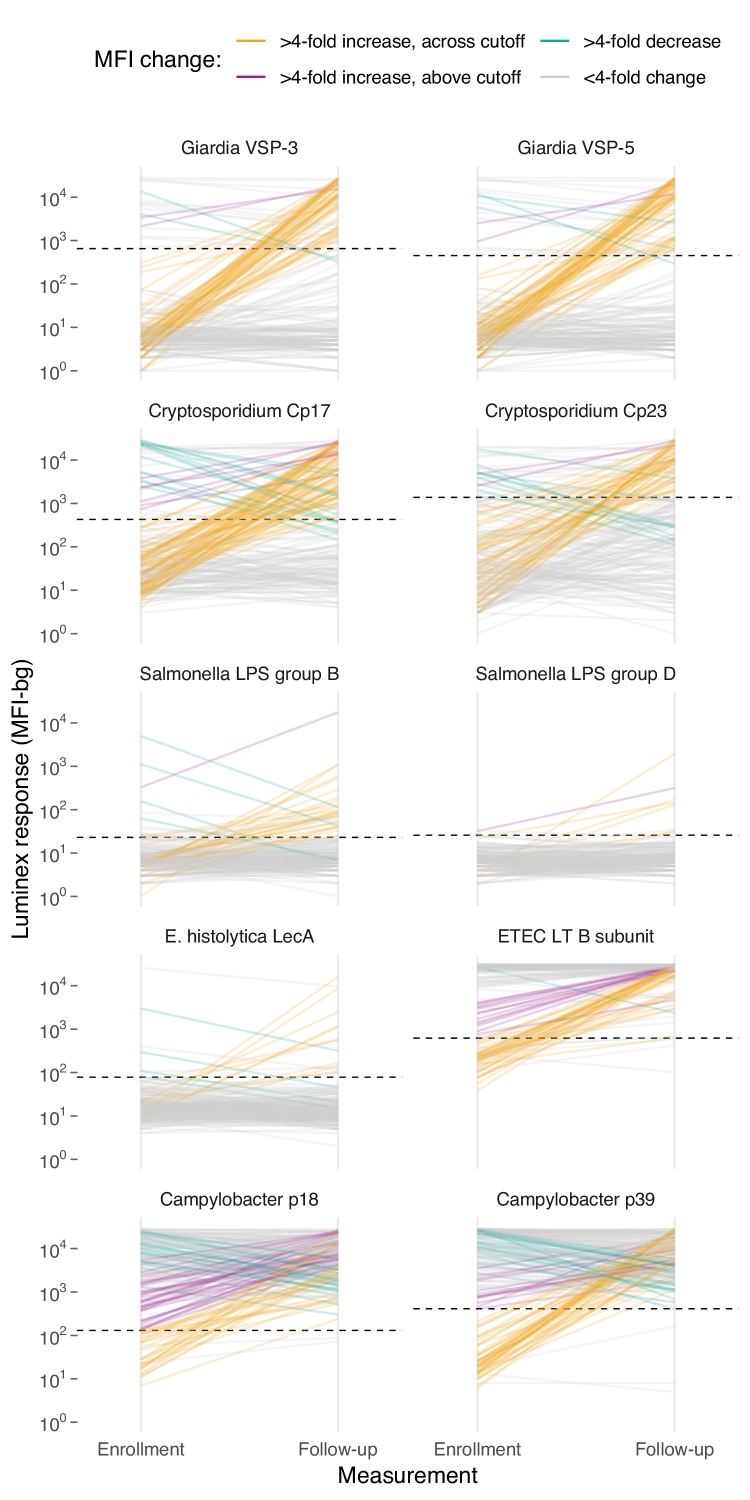
Figure 4—figure supplement 1. Longitudinal changes in IgG response between enrollment and follow-up among 205 children ages 4–17 months in Asembo, Kenya, 2013.

Figure 4—figure supplement 1.

Horizontal dashed lines mark seropositivity cutoffs for each antibody. IgG response measured in multiplex using median fluorescence units minus background (MFI-bg) on the Luminex platform. Created with notebook (https://osf.io/6gk2q), which includes additional visualizations, and data (https://osf.io/2q7zg).
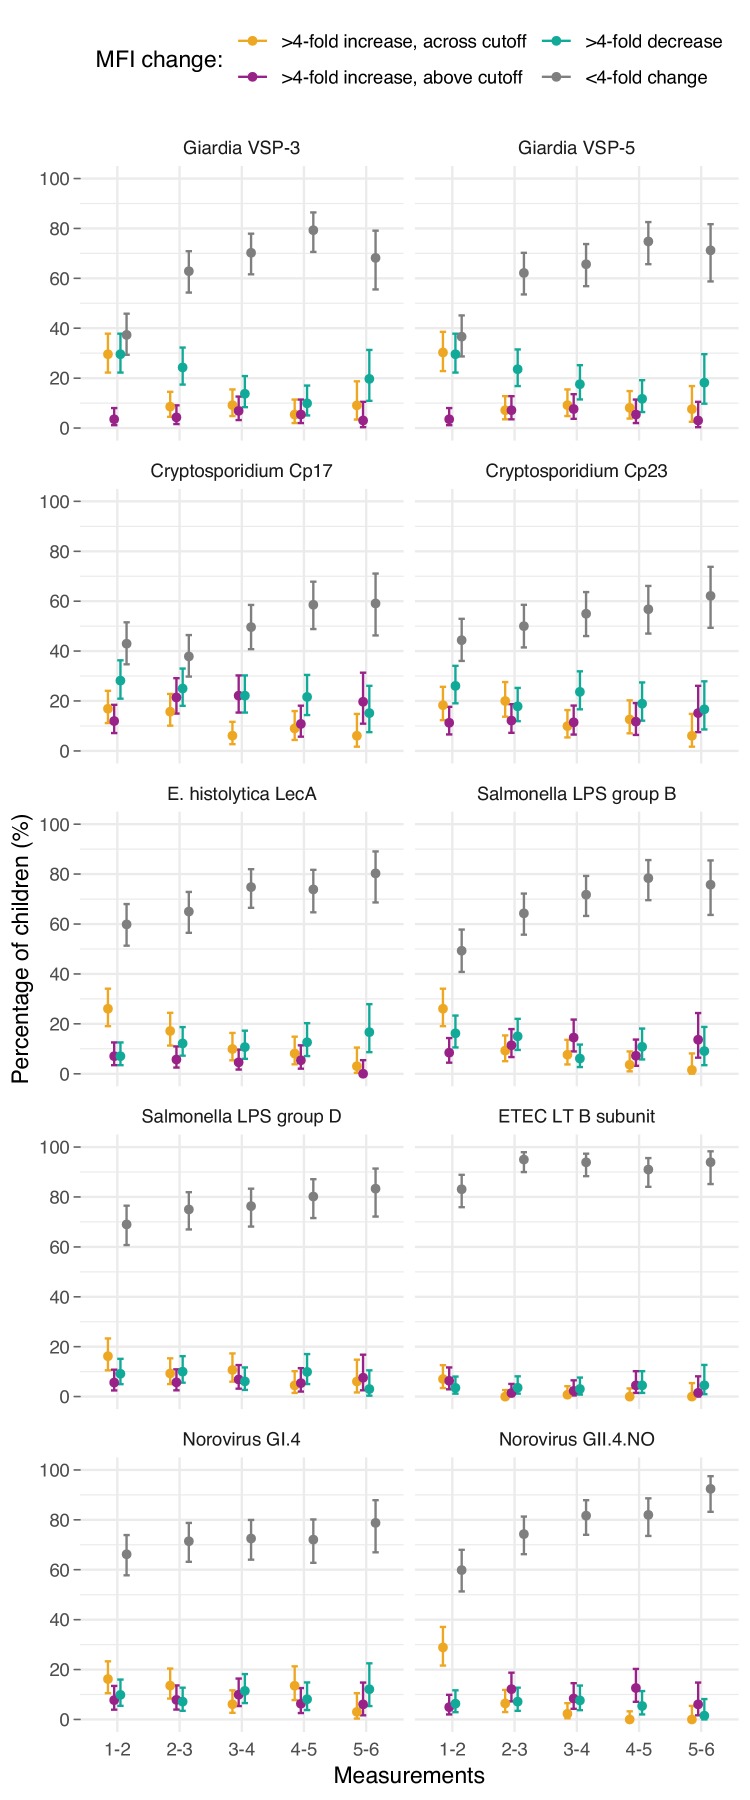
Figure 4—figure supplement 2. Proportion of children ages 0–11 years with different longitudinal changes in IgG response over six repeated measurements in Leogane, Haiti, 1990 – 1999.

Figure 4—figure supplement 2.

Measurements were spaced by approximately 1 year (median spacing = 1, IQR = 0.7, 1.3). The number of children measured at each visit was: n1 = 142, n2 = 142, n3 = 140, n4 = 131, n5 = 111, n6 = 66); 29 children had >6 measurements that are not shown. IgG response measured in multiplex using median fluorescence units minus background (MFI-bg) on the Luminex platform. Created with notebook (https://osf.io/vyhra) and data (https://osf.io/3nv98).
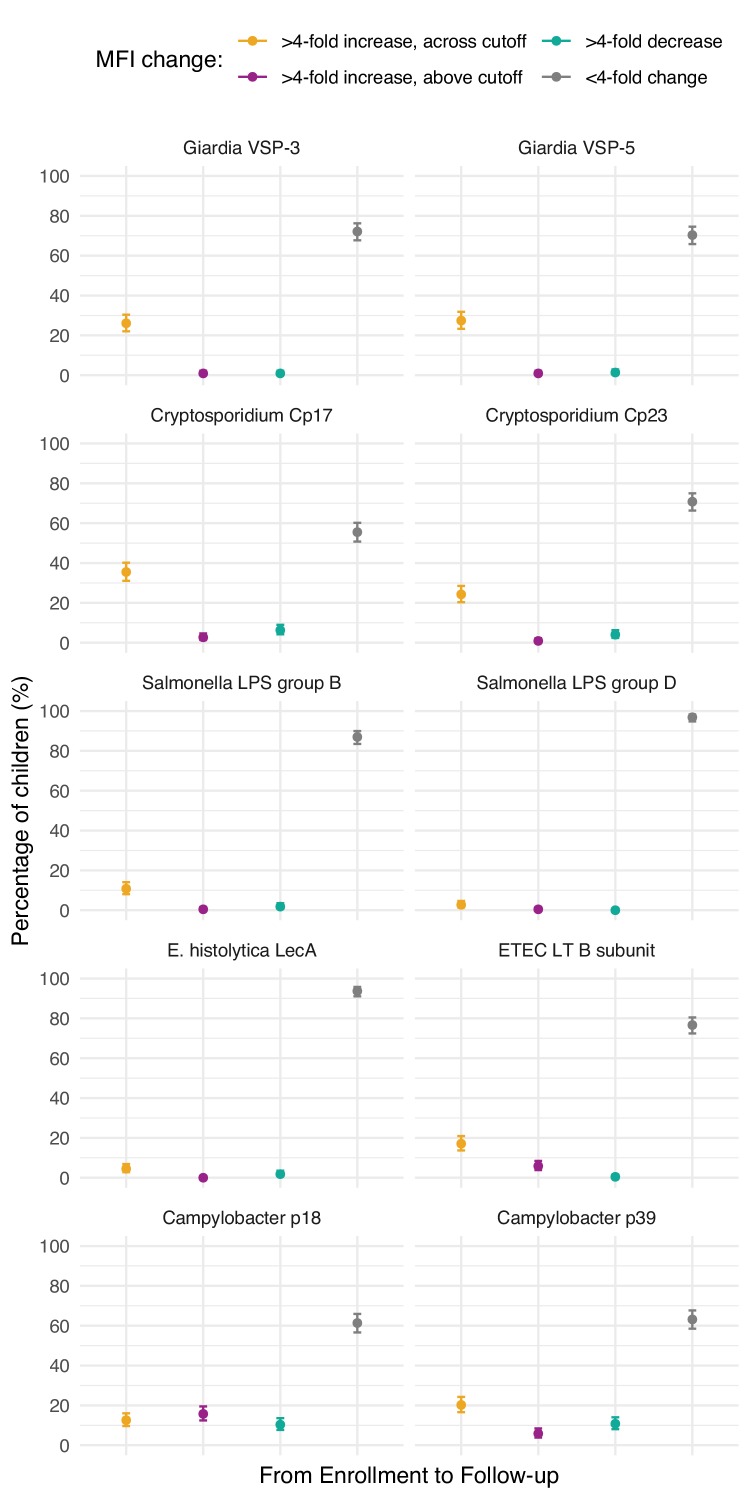
Figure 4—figure supplement 3. Proportion of children ages 4–17 months with different longitudinal changes in IgG response between enrollment and follow-up 6 months later in Asembo, Kenya, 2013.

Figure 4—figure supplement 3.

N = 205 children measured longitudinally. IgG response measured in multiplex using median fluorescence units minus background (MFI-bg) on the Luminex platform. Created with notebook (https://osf.io/6gk2q) and data (https://osf.io/2q7zg).