. 2019 Aug 19;8:e45594. doi: 10.7554/eLife.45594

Figure 5. Average force of infection versus seroprevalence for enteropathogens measured in the Kenya and Haiti cohorts.

Force of infection estimated from prospective seroconversion rates. Vertical lines indicate 95% confidence intervals. Created with notebook (https://osf.io/jp9kf) and data (https://osf.io/2q7zg, https://osf.io/3nv98). Figure 5—figure supplement 1 includes estimates from Haiti stratified by age bands.

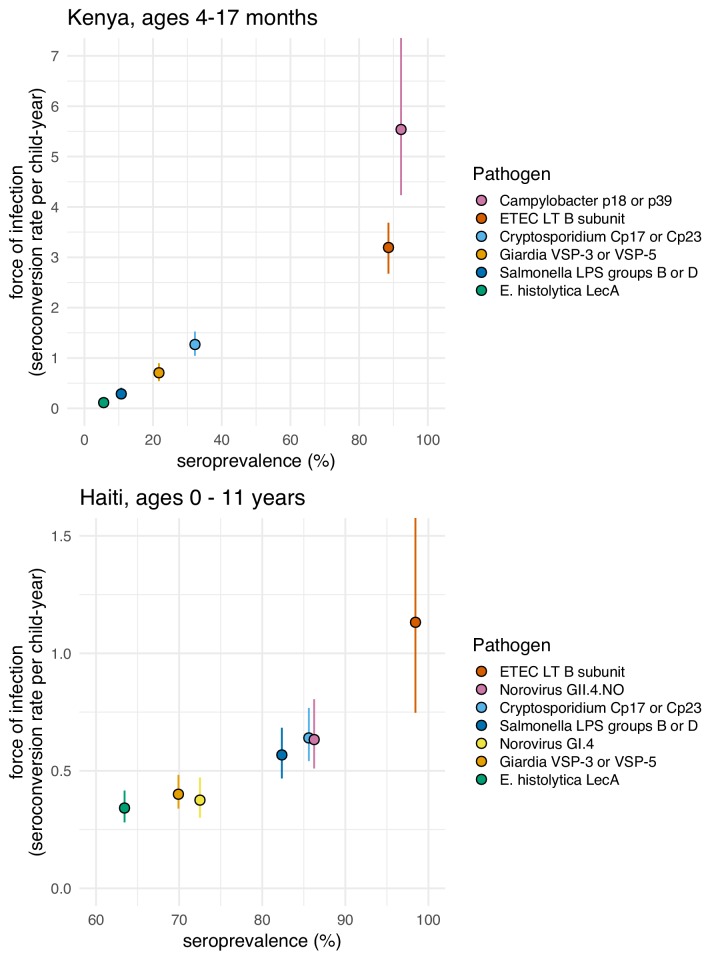
Figure 5.

Figure 5—figure supplement 1. Average force of infection versus seroprevalence for enteropathogens measured in the Haiti cohort, stratified by different age bands.

Figure 5—figure supplement 1.

Force of infection estimated from prospective seroconversion rates. Vertical lines indicate 95% confidence intervals. Created with notebook (https://osf.io/jp9kf) and data (https://osf.io/3nv98).