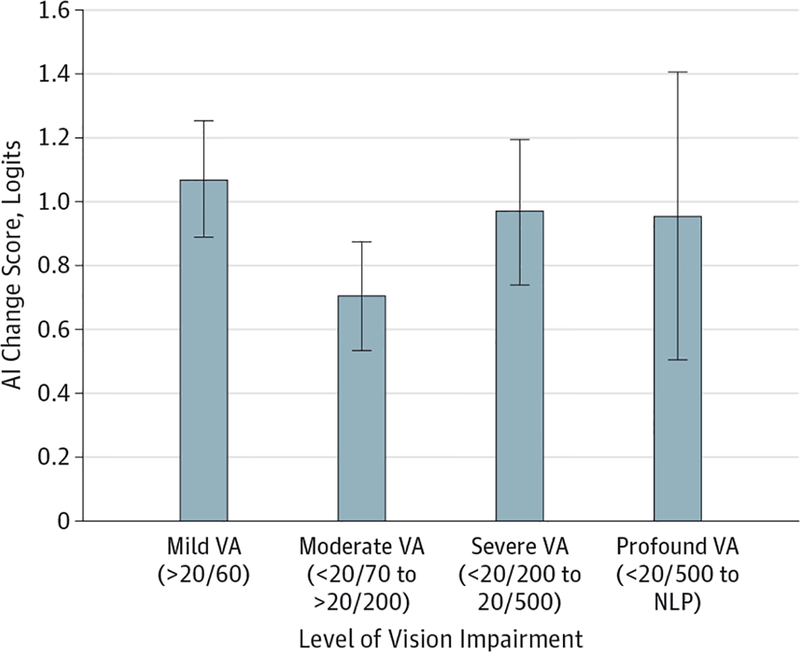
Figure 2. Change in Overall Visual Ability by Degree of Visual Impairment.
Patients with a visual acuity (VA) of better than 20/60 or worse than 20/200 show the greatest effects of low vision rehabilitation. Smaller effects are observed in patients with moderate loss of VA (<20/70 to >20/200). AI indicates Activity Inventory; NLP, no light perception. Error bars indicate 95% CIs.

