
FIG. 5.
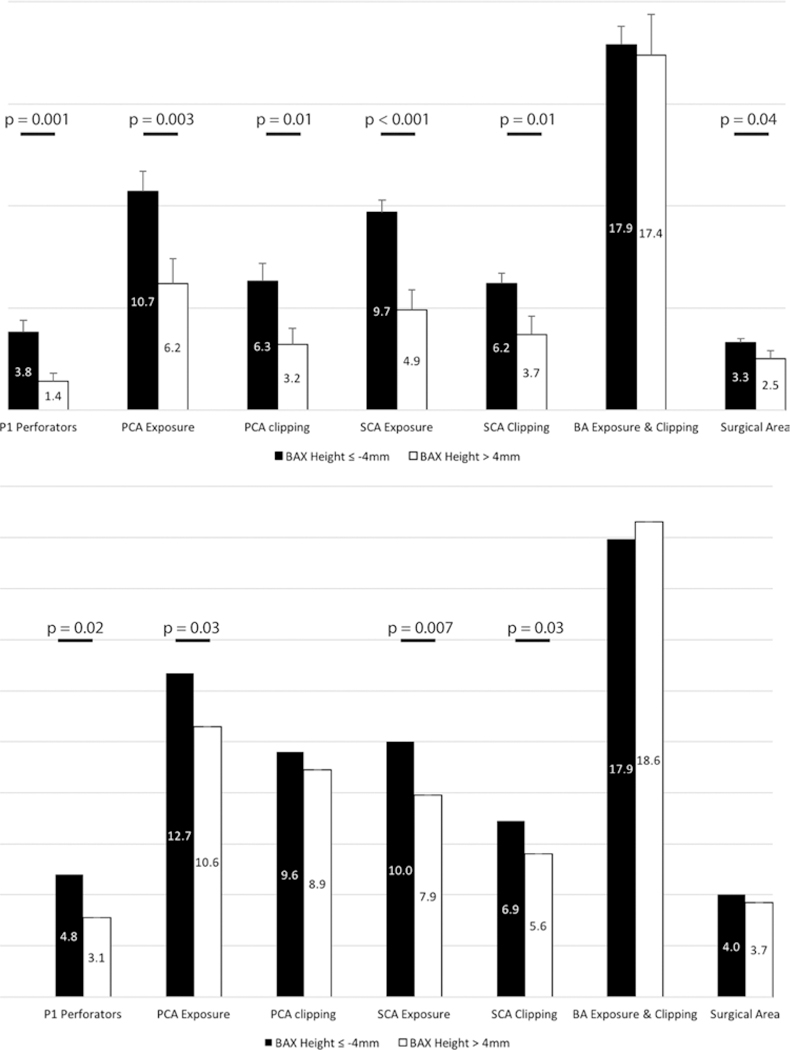
Bar graphs showing comparisons between different measured variables using a cutoff point of −4 mm for the basilar apex height. At this cutoff point, the differences between variables in 2 groups were maximal and with most frequent statistically significant differences (compared to other cutoff points). Upper: Graph showing the analysis for EEA without PT. Lower: Graph showing the analysis for EEA with PT. Statistically significant comparisons are shown with horizontal bars as well as p values for 2-sample t-test. Please see text and Supplemental Tables 1 and 2 for further information.