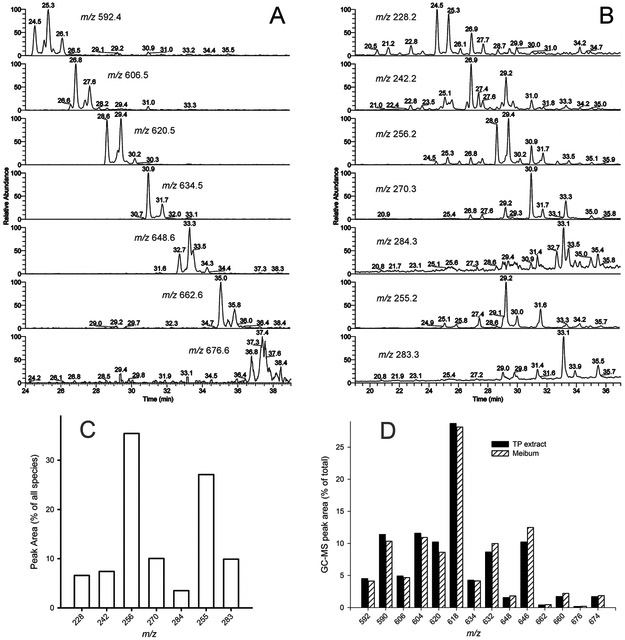
Figure 4. Gas chromatographic-mass spectrometric analysis of wax esters extracted from mouse tarsi.
Panel A. Extracted ion chromatograms of saturated wax esters. Each trace corresponds to a particular ion.
Panel B. Extracted ion chromatograms of FA residues formed due to the spontaneous in-source fragmentation of WE. Each trace corresponds to a particular ion.
Panel C. Relative abundances of FA in the WE fraction of mouse tarsal plate extracts. Note that saturated FA residues produced M+. ions, while unsaturated FA were visible as (M + H)+ adducts.
Panel D. Relative abundances of saturated and unsaturated WE in the mouse tarsal plate extracts and expressed meibum. The analytes were detected as M+. molecular ions (loss of electron). The results are shown as fractions (in %) of the total pool of analytes shown in the Figures.

