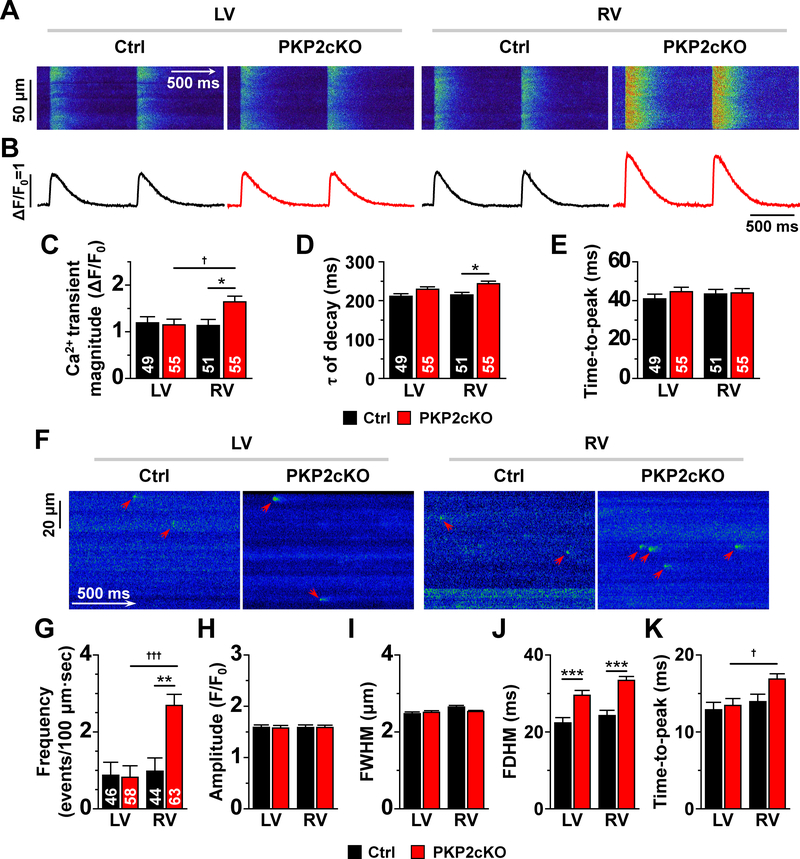
Figure 1. Ca2+ transients and Ca2+ sparks in RV and LV myocytes from control and PKP2cKO hearts.
Time-space plots (A) and time course of Ca2+ transients (B) obtained by line-scans (1.43 ms/line) during field stimulation (1 Hz) of myocytes isolated from the left ventricle (LV) and right ventricle (RV) of control (Ctrl) and plakophilin-2 conditional knockout (PKP2cKO) mice. Panels C-E show compiled data for mean Ca2+ transient magnitude (relative amplitude; ΔF/F0; C), time constant of Ca2+ transient decay (ms; D) and time-to-peak (ms; E). Black and red bars depict data from Ctrl and PKP2cKO myocytes, respectively. Panel F: confocal line-scan images of Ca2+ sparks (green; emphasized by red arrowheads) recorded from control (Ctrl) and PKP2cKO myocytes isolated from either LV or RV. Cumulative data are shown in panels G-K. Black and red bars represent data obtained from control and PKP2cKO mice, respectively. G: Mean frequency of Ca2+ sparks, reported as average number of events per second in a 100 μm line. H: Average peak amplitude (F/F0). I: full-width at half maximum (FWHM; μm). J: full duration at half maximum (FDHM; ms). K: time-to-peak (ms). For all bar graphs: black, control; red, PKP2cKO. Number of cells studied are noted in the corresponding bars. For panels C-E: Statistical tests: Hierarchical test was first attempted. Output indicated whether to proceed via two-way repeated measures analysis of variance (ANOVA)-Bonferroni (details in “Methods”). Hierarchical test used for transient amplitude. Two-way repeated measures ANOVA-Bonferroni for tau and time to peak. Total mice: 9 controls and 11 PKP2cKO. *p<0.05 vs. control, †p<0.05 vs. LV. For panels G-K: Numbers of sparks/cells/mice in control dataset: 618 sparks from 46 LV cells; 594 sparks from 44 RV cells; 6 mice. Numbers of sparks/cells/mice in PKP2cKO dataset: 675 sparks from 58 LV cells; 1842 sparks from 63 RV cells; 7 mice. Statistical test: Hierarchical analysis. See “Methods” for details. **p<0.01 vs. control; ***p<0.001 vs. control; †p<0.05 vs. LV; †††p<0.001 vs. LV.

